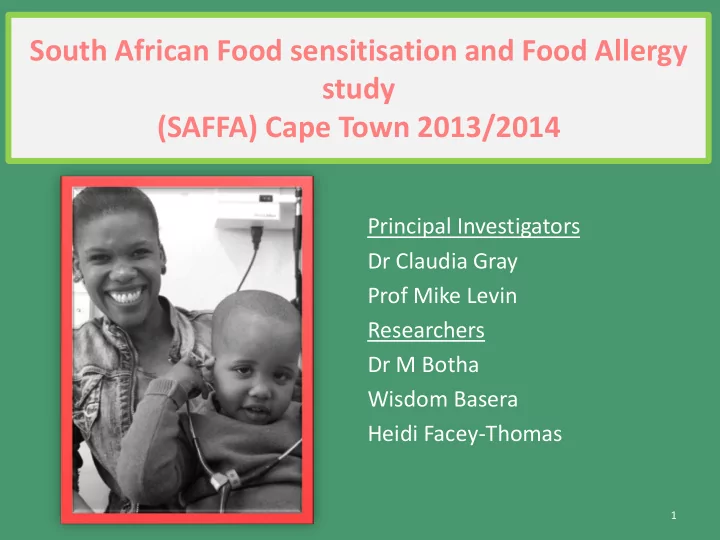

South African Food sensitisation and Food Allergy study (SAFFA) Cape Town 2013/2014 Principal Investigators Dr Claudia Gray Prof Mike Levin Researchers Dr M Botha Wisdom Basera Heidi Facey-Thomas 1
Introduction • The prevalence of allergic disorders such as asthma, allergic rhinitis and eczema has been rising rapidly in rapidly urbanising communities in several African countries • Food allergy traditionally perceived to be rare in Africa • There is emerging evidence however that this might be changing and that we might be seeing the start of the “second wave” of allergic diseases especially in rapidly developing countries on the continent – mirroring what has happened in high income countries over the last few decades. 2
FA Prevalence in Preschool children (< 5yrs) Prescott et al.World Allergy Organisation Journal 2013,6:21
Objectives To determine the prevalence of IgE-mediated Food sensitisation and Food Allergy in unselected 12-36 month old children in Cape Town.
Adverse reaction to food Toxic Non toxic (microbiological (food hypersensitivity) Pharmacological) Immune mediated Non immune mediated (food allergy) (Food intolerance) Enzymatic Other Non IgE mediated Pharmacological IgE mediated
Methodology Sampling Tools • Questionnaire • Skin Prick Test Peanut, egg, cow’s milk, soya, wheat, fish, hazelnut • Open Oral Food Challenge SPT≥1mm; NOT proven tolerant to age appropriate portion Non-participants sex, age, ethnicity, history of atopy
Recruitment and Assessment 470 eligible children 310 160 Non-responders 66% response rate 291 19 nonparticipants 94participation rate 284 7 incomplete 98% completed
SAFFA Demographics: Ethnicity Cape Town census 2011: SAFFA study participants Children 0-4 years N=284 Black African 46% Black African 46.4% Mixed Race/Coloured 42.4% Mixed Race/Coloured 45.4% Caucasian11.6% Caucasian 8.2% 8
Results 284 Participants 245 39 SPT -ve SPT≥1mm • 86.3% 26 13 Not Allergic Tolerant Not tolerant • 12% Sensitised but not allergic 8 • 1.8% 5 Food Allergic OFC +ve OFC -ve 9
Spectrum of sensitisation and Food Allergy Cow’s Overall Egg Peanut Milk Hazelnut Soya Wheat Fish n 95% CI SPT≥1mm 11.6% 9.5% 5.3% 3.5% 1.8% 1.8% 1.4% 1.1% 33 9.7-17.8 SPT≥3mm 9.9% 7.8% 3.2% 1.8% 0.7% 0.7% 0 0 28 6.4-13.3 SPT≥7mm 4.2% 3.9% 1.1% 0.4% 0.4 0 0 0 12 1.9-6.6 1.8% 1.4 1.1 5 4 3 OFC 0.6-4.1 0.4-3.6 0.2-3.1 positive 10
SAFFA: Prevalence of Polysensitisation Total number of foods sensitised to 0 1 2 ≥3 86.3% 8.5% 2.8% 2.5% 245 24 8 7 11 SAFFA study: Unpublished data August 2014
Sensitisation and ethnicity SPT Any Food Black African Mixed race Caucasian P-values n=131 n=118 n=33 ≥1mm 9.9% 13.6% 12.1% 0.7% ≥3mm 9.2% 10.2% 12.1% 0.8% ≥7mm 2.3% 5.9% 6.0% 0.3%
Summary (1) • Food allergy point prevalence in unselected urban South African children in a representative sample of 12-36 month old children = 1.8% • Provides a basis for further monitoring of a population possibly only at the beginning of the food allergy epidemic. • High sensitisation rates in Black African and Mixed race children are similar to the high rates of aeroallergen sensitisation seen in unselected and allergic populations.
Summary (2) • Further objectives for the SAFFA study – Describe prevalence of socio-demographic, environmental and family related risk factors in study population – Compare prevalence of sensitisation and food allergy between • urban Caucasian, Mixed race and black African children with more power in larger sample size. • rural and urban Black African Xhosa children – Generate population-specific cut-off levels for SPT and Immunocaps with 95%positive predictive values.
Thank you
Recommend
More recommend