Secured, but still poor: A comparative analysis of the formalisation - PowerPoint PPT Presentation
Secured, but still poor: A comparative analysis of the formalisation of land rights in Namibia 27 January 2016 Why do we want to secure land rights? 1990: Start of a comprehensive land reform process National Conference on Land Reform and
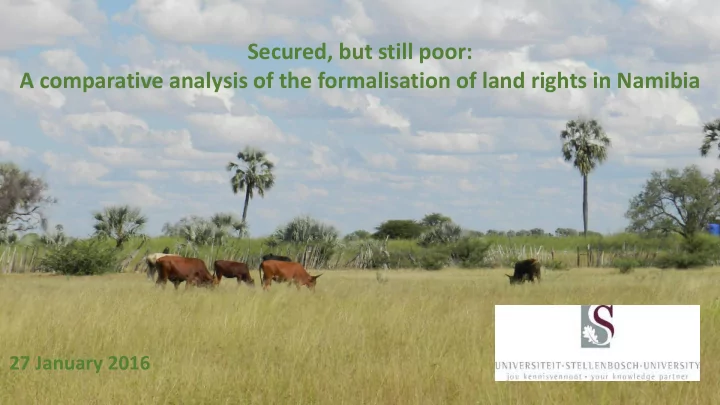
Secured, but still poor: A comparative analysis of the formalisation of land rights in Namibia 27 January 2016
Why do we want to secure land rights?
• 1990: Start of a comprehensive land reform process • National Conference on Land Reform and the Land Question, 1991 • Land Conference resulted in land policy development • Agricultural (Commercial) Land Reform Act, 1995 • National Resettlement Policy, 1997 • National Land Policy, 1998 • Communal Land Reform Act (CLRA), 2002 • The National Conference on Land Reform and the Land Question, 1991 • Consultative Conference on Customary Law, Ongwediva 1993 • People’s Land Conference, Mariental 1994 • Consultative Conference on Communal Land Administration, 1996
Land on the continental and international agenda
What can we learn from Namibia?
Omusati Kavango Otjozondjupa Hardap Total population 243,166 223,352 143,903 79,507 Population density 9.1 4.6 1.4 0.7 (persons/km²) Cultural group Ovambo Kavango Herero Nama Main language Oshiwambo Kavango Herero Khoekhoegowab Parcel density Region per km² Kavango n/a Land uses (small-scale Crop and Large Crop and Large Large and Small Small Livestock Omusati 28 agriculture on communal Livestock Livestock Livestock Hardap 1.4 land) Otjizondjupa 1.8 Average annual rainfall (mm) 400-450 500-550 400-450 150-200 Total number of registered 21,261 0 2,647 1,426 communal land parcels (Oct. 2014) Total number of expected 54,000 47,000 5,000 2,000 communal land parcels to be registered Percentage of total already 40% 0 53% 71% registered
Omusati Region
Otjozondjupa Region
Hardap Region
Main income on communal farms
Registered for a land right? 35 30 25 20 15 10 5 0 Kavango Omusati Hardap Otjizondjupa Yes No
Registration vs. intended investment in housing structures 50% 45% 40% 35% 30% 25% 20% 15% 10% 5% 0% Brick Expansion and Maintenance Registered Not registered
Registration vs. plans to develop farming operations 100% 90% 80% 70% 60% 50% 40% 30% 20% 10% 0% Plans to develop No plans to develop right now Registered Not registered
Is the decision to take a loan based on having a land right? 100% 90% 80% 70% 60% 50% Does having a land right influence decision to invest in farm? 40% 100% 30% 90% 80% 20% 70% 10% 60% 0% Yes No 50% 40% 30% 20% 10% 0% Yes No
Proof of permission 80 70 60 50 40 30 Fear of land being taken away 120 20 10 100 0 80 Kavango Omusati Hardap Otjizondjupa Total Written Verbal No proof 60 40 20 0 Kavango Omusati Hardap Otjizondjupa Total Yes No
Do you trust your TA more than Govt? 120 100 80 60 40 20 Can your TA protect your land rights more than Govt can? 120 0 Kavango Omusati Hardap Otjizondjupa Total 100 Yes No Equally 80 60 40 20 0 Kavango Omusati Hardap Otjizondjupa Total Yes No Equally
Do you feel safer on your land after obtaining a land right? 90% 80% 70% 60% 50% 40% Do you feel safer on your land after obtaining a land right? 30% 70% 20% 10% 60% 0% Safer Same 50% 40% 30% 20% 10% 0% Male Female
The lessons for change are….?
THANK YOU E-Mail: matthaei.elke@gmail.com
Recommend


More recommend
Explore More Topics
Stay informed with curated content and fresh updates.