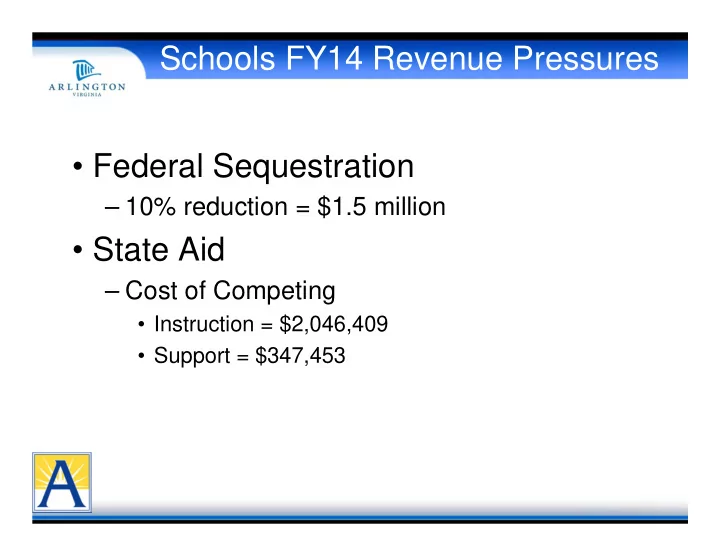

Schools FY14 Revenue Pressures • Federal Sequestration – 10% reduction = $1.5 million • State Aid – Cost of Competing • Instruction = $2,046,409 • Support = $347,453
Schools FY14 Expenditure Pressures Class Size by Grade (2011-12) 2400 2252 2300 2200 2087 2076 2100 2034 2011 1970 2000 1896 1900 1771 1800 1700 1633 1624 1600 1468 1425 1452 1405 1500 1436 1418 1373 1400 1308 1316 1314 1300 1205 1200 1100 1000 900 800 700 600 500 400 300 200 100 0 P-4 P-3 P-2 P-1 K 1st 2nd 3rd 4th 5th 6th 7th 8th 9th 10th 11th 12th E-1 E-2 E-3 E-4
Schools FY14 Expenditure Pressures K-12 Enrollment Projections 2012-2021 33000 5 Year Linear Regression 5 Year Average Rate of Change 31000 3 Year Average Rate of Change Increase of 2% Per Year 29000 Increase of 3% Per Year 27000 Students 25000 23000 21000 19000 17000 2005 2006 2007 2008 2009 2010 2011 2012 2013 2014 2015 2016 2017 2018 2019 2020 2021 Year
Schools FY14 Expenditure Pressures • Growing Enrollment – 21% increase since FY 2008 – 3.8% increase projected for FY14 – Per WABE guide, Arlington highest projected growth for FY13 (tied with Falls Church) • Capacity Issues – Elementary at 103.3% and climbing – Overall projected at 102.5% for FY14 – As new building space comes on board, additional operational costs are needed
Schools FY14 Expenditure Pressures • Cost of Enrollment – Staffing and materials – Relocatables – Average cost past 4 years = $9.5 million – Projected cost for FY14 = $10 million
Schools FY14 Expenditure Pressures • Compensation – Cost of Living • No increase 3 of last 4 years – Step Increase • Only 1 full Step last 4 years
Recommend
More recommend