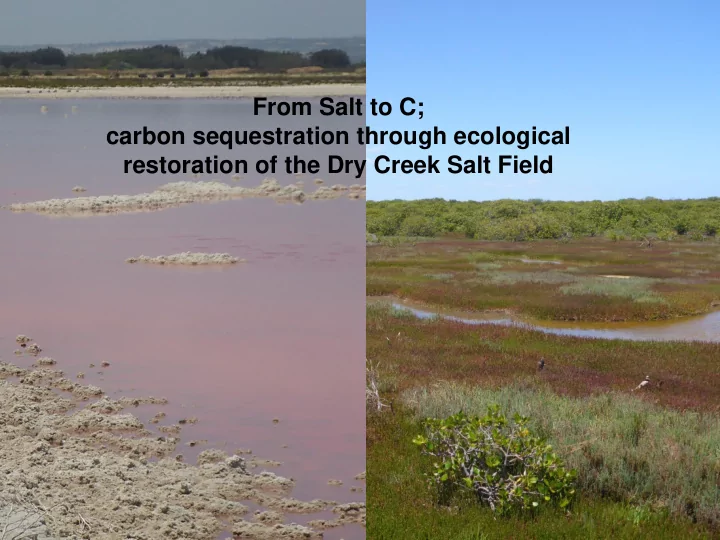

From Salt to C; carbon sequestration through ecological restoration of the Dry Creek Salt Field
Presentation Outline ➢ Science behind carbon sequestration in the tidal trial (Luke) • What is the Blue Carbon sequestration potential of the salt fields in the course of restoration? • How do we measure C changes? • What are the processes driving the restoration and carbon dynamics? ➢ Pathway to Market (Russell) • International and National Methodologies • Where is the demand? • What additional benefits can be obtained through restoration?
➢ Mangroves & saltmarshes have a high potential for carbon sequestration Alongi, 2014 “Blue Carbon” - Recognition of relevance of carbon sequestration in coastal wetlands and aquatic ecosystems (mangroves, saltmarshes and seagrass beds) - Enhancement of their carbon storage potential
What are we are trying to achieve? Reconnection to tidal flows will lead to: • revegetation with mangrove & saltmarsh; • increased C capture, and • reduced GHG emissions reduction .
T1: Carbon dynamics T2: Revegetation T3: C accounting & T4: Co-benefit & sequestration experiments offset registration analysis & up-scaling • C stock • Transplantation & • Evaluation of C • Geodatabase measurement seedling accounting refinement (biomass, soils) experiments methodologies for Australian context • Data base for • Sediment • Growth & C stock local/regional ESV & • Roadmap for co-benefits accumulation rates measurement in registration experimental plots (biomass, soils) • GHG emission • Co-benefit analysis • C accounting & measurements (social, economic & audit for project ecosystem services) data • Up-scaling of C- offset & synthesis • Registration with Clean Energy Regulator T5: Translation of outcomes, pathway to market
T1: Carbon dynamics & sequestration CO 2 O 2 CH 4 Mangroves & saltmarshes Above- ground biomass Disturbance Trapping of carbon Below-ground Exchange and sediment from biomass processes & adjacent habitats (live & dead Export roots) POC, DOC, DIC Leaf litter [ decomposition] Consumption & bioturbation Burial & sediment accretion Slow decomposition Long-term storage of soil (input > decay) carbon
T1: Carbon dynamics & sequestration • C stock measurement (e.g. biomass, soils, suspended matter) • Sediment accumulation rates -short-term: Sediment Elevation Tables (SETs) -long-term: 210 Pb, 137 Cs • GHG emission measurements Li-8100A gas flux measurements Measurements • Cahoon et al. (2002)) baseline • ~9 months • ~18 months ➢ Increases in C stock and sequestration through revegetation, reduction in emissions
T2: Revegetation experiments • Transplantation & seedling experiments e.g. mangrove propagules, rhizomes small plots inside & outside of pond, control, different elevation • Growth & C stock measurement in experimental plots (biomass, soils, emissions) CO 2 CO 2 CO 2 Succession CH 4 CH 4 CH 4 CH 4 ➢ Feasibility assessment for revegetation, identification of ‘windows of opportunity, reduction in GHG emissions, C-stock increase during recolonisation
T3: C accounting & offset registration International Verified Carbon Standards Project Partners: Silvestrum Climate Associates USA Steve Crooks & Igino Emmer. Author of the Verified Carbon Standard
Reduce Australia’s domestic emissions by 26 to 28 per cent below 2005 levels by Why? 2030 . How? The total cumulative abatement opportunity in the period from 2021 to 2030 was estimated to be around 960 Mt CO2-e. Energetics (2016) Modelling and analysis of Australia’s abatement opportunities
Ene Energetic ics re repor ort - Aba Abatement po pote tentia ial l by by 2030 Mt Mt CO2 CO2-e 360 Mt CO2 247 Mt CO2 Land sector Vegetation across 11 abatement All have methodologies that opportunities create a ACCU or voluntary (policy, methods carbon credit. not all fully developed) Emissions Reduction Fund
T4: Co-benefit analysis & up-scaling Co-benefit analysis : • Economic returns • Community development • Knowledge • Habitat connectivity • Biodiversity increase • Fisheries enhancement • Resilience • Flood mitigation • Climate change adaptation Geospatial data base Land cover classes (a) habitat condition, restoration phases (b) link with co-benefit database
T1: Carbon dynamics & sequestration • Up-scaling of C-offset & synthesis T2: Revegetation experiments Landscape scale restoration – environmental outcomes T3: C accounting & Co-benefit model – spatial analysis of co-benefits over time offset registration Measure and describe co-benefits – link to SDG and CBD
T5: Translation of outcomes, pathway to market Voluntary Market Supply and Demand & the customer
L’Oréal estimates that it will be progressively insetting about 400,000 tCO2e per year by 2020 to counterbalance its unavoidable emissions as well as emissions associated with downstream transportation.
T5: Translation of outcomes, pathway to market Raising Ambitions: State of the Voluntary Market, (2016) Ecosystem Market Place
Adelaide - Carbon offsets totalling approx. 400 - 500,000 tonnes CO 2 -e per annum maybe required by 2019/20.
Dry Creek – Coastal Carbon Variables Carbon price Hectares Yield Customer preferences Potential Lower range ‘at scale’ estimates at 40,000 T CO 2 e Upper and lower scenarios deliver positive cash flow
Proof of concept • Test carbon accounting methods • Inform decision on restoration of larger salt field area – solving a problem • Develop credits/brand for customers • Demonstrate the value of native vegetation through integrated landscape restoration • Creation of new carbon investment for restoration of degraded land
Proje ject Tea eam Prof Sabine Dittmann A/Prof James Stangoulis A/Prof Erick Bestland Dr Petra Marschner A/Prof Huade Guan Molly Whalen Harpinder Sandhu Dr Murray Townsend Dr Luke Mosley Jason Quinn Prof Paul Sutton Russell Seaman Dr Stephen Crooks Paul Sutton Igino Emmer Beverley Clarke Prof Robert Costanza Jason Quinn Harpinder Sandhu
Recommend
More recommend