Roadmap for Section 11.4 Lab experiments investigating: CPU - PDF document
Lab Manual - OS6 Device Management Unit OS11: Performance Evaluation 11.4. Lab Manual Roadmap for Section 11.4 Lab experiments investigating: CPU consumption Low memory conditions 3 1 Lab Manual - OS6 Device Management Lab: Observing
Lab Manual - OS6 Device Management Unit OS11: Performance Evaluation 11.4. Lab Manual Roadmap for Section 11.4 Lab experiments investigating: CPU consumption Low memory conditions 3 1
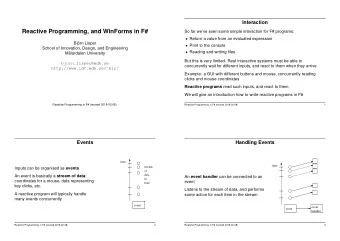
Lab Manual - OS6 Device Management Lab: Observing Kernel Mode vs User Mode Processor Time 1. Run Performance Tool (perfmon.msc) 2. Click the Add button (+) on the toolbar. 3. With the Processor performance object selected, click the % Privileged Time counter and, while holding down the Ctrl key, click the % User Time counter. 4. Click Add, and then click Close. 5. Move the mouse rapidly back and forth and notice % Privileged Time line going up when you move the mouse around. 4 Lab Objective: Observe Performance Tool’s CPU Usage 1. Run the Performance Tool (perfmon.msc) 2. Click the Add button (+) on the toolbar 3. Change the Performance Object to Process 4. Select the % Privileged Time and % User Time counters 5. Select all processes in the Instance box (except the _Total process). 6. Click Add, and then click Close 7. Move the mouse rapidly back and forth 8. Press Ctrl+H to turn on highlighting mode 9. Scroll through the counters at the bottom of the display to identify the processes whose threads were running when you moved the mouse, and note whether they were running in user mode or kernel mode 5 2
Lab Manual - OS6 Device Management Lab: Examining CPU Load with Process Explorer Run Process Explorer Click View->System Information If a multiprocessor system, click the “Show one graph per CPU” in the lower left hand corner Run CPUStres (part of CRK tool set) and set thread activity to Maximum Notice 100% CPU utilization on one CPU If a multiprocessor system, run one copy of CPUStres per processor 6 Example Screen Snapshot from previous lab 7 3
Lab Manual - OS6 Device Management Lab: Examining CPU Load with Performance Monitor Run CPUStres (part of CRK tool set) and set priority to “Below Normal” and activity to “Maximum” Run the Performance Tool (perfmon.msc) Open the add counter dialog and select the process object Select the CPUStres process and add two counters: % User Time and % Privileged Time % User Time should be near 100%,while % Privileged Time should be small or zero Drag the CPUStres window around rapidly and notice % Privileged Time increase due to windowing system call activity 8 Lab: Low Memory Conditions Run Performance Monitor (perfmon.msc) and add two counters to the graph: Memory / Available Bytes Paging File / % Usage To cause a low memory condition, run RamOptimize.exe (part of CRK tool set – source included) and click “Optimize” Notice Available Bytes goes down and Paging File usage goes up as RamOptimize process consumes virtual memory When complete, Available Bytes will be much higher since the RamOptimize process releases all the memory it allocated, causing it to be returned to the system 9 4
Lab Manual - OS6 Device Management Lab: Tracing TCP/IP Activity Performance tool can enable logging tracerpt.exe and tracedmp.exe generate dumpfile.csv and summary.txt (see notes) 10 Lab: Generating an Easy Crash Run NotMyFault (from Sysinternals) and select “High IRQL fault (kernel mode)” Press “Do Bug” This causes the driver to: Allocate a paged pool buffer Free the buffer Raise IRQL ≥ DISPATCH_LEVEL Touch the buffer ,which causes a crash 11 5
Lab Manual - OS6 Device Management Lab: Analyzing an Easy Crash After generating the crash from the “Generating an Easy Crash” lab, when the system reboots, analyze the crash as follows: Run Windbg (Debugging Tools for Windows) Set symbol path to use Microsoft symbol server Open crash dump (in \Windows\Minidump\xxx.dmp) The debugger should show the probable cause of the crash as Myfault.sys 12 Lab: Buffer Overflow Crash Run NotMyFault (from Sysinternals) and select “Buffer Overflow” Press “Do Bug” This causes the Myfault driver to allocate a buffer and then overwrite the 40 bytes following The system may not crash immediately since the corrupted buffer may not be referenced right away If the system does not crash, keep clicking “Do Bug” until it does After the reboot, open the crash with WinDbg to see the probable cause 13 6
Lab Manual - OS6 Device Management Lab: Using Verifier to Catch a Buffer Overflow Run Verifier.exe (in \Windows\System32) and enable Special Pool on Myfault.sys Reboot Run NotMyFault (from Sysinternals) and select “Buffer Overflow” Press “Do Bug” – the system will crash instantly Reboot and analyze the crash 14 7
Recommend
More recommend
Explore More Topics
Stay informed with curated content and fresh updates.

