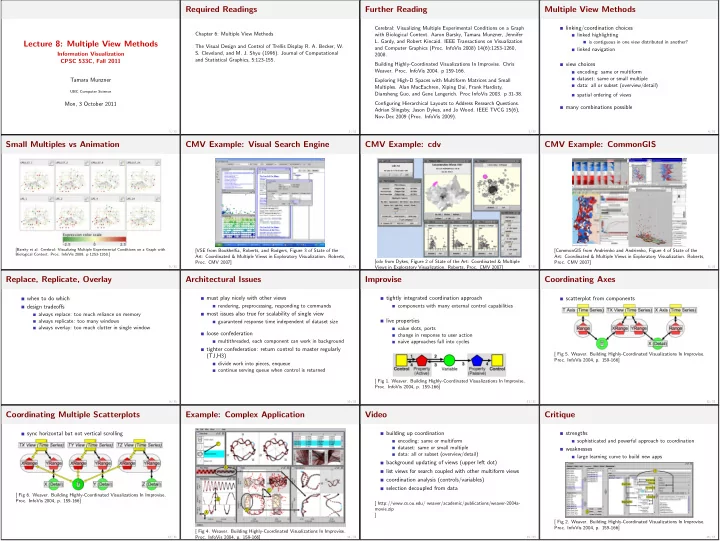

Required Readings Further Reading Multiple View Methods Cerebral: Visualizing Multiple Experimental Conditions on a Graph linking/coordination choices Chapter 6: Multiple View Methods with Biological Context. Aaron Barsky, Tamara Munzner, Jennifer linked highlighting L. Gardy, and Robert Kincaid. IEEE Transactions on Visualization Lecture 8: Multiple View Methods is contiguous in one view distributed in another? The Visual Design and Control of Trellis Display R. A. Becker, W. and Computer Graphics (Proc. InfoVis 2008) 14(6):1253-1260, linked navigation Information Visualization S. Cleveland, and M. J. Shyu (1996). Journal of Computational 2008. and Statistical Graphics, 5:123-155. CPSC 533C, Fall 2011 Building Highly-Coordinated Visualizations In Improvise. Chris view choices Weaver. Proc. InfoVis 2004. p 159-166. encoding: same or multiform Tamara Munzner dataset: same or small multiple Exploring High-D Spaces with Multiform Matrices and Small data: all or subset (overview/detail) Multiples. Alan MacEachren, Xiping Dai, Frank Hardisty, UBC Computer Science Diansheng Guo, and Gene Lengerich. Proc InfoVis 2003. p 31-38. spatial ordering of views Configuring Hierarchical Layouts to Address Research Questions. Mon, 3 October 2011 many combinations possible Adrian Slingsby, Jason Dykes, and Jo Wood. IEEE TVCG 15(6), Nov-Dec 2009 (Proc. InfoVis 2009). 1 / 33 2 / 33 3 / 33 4 / 33 Small Multiples vs Animation CMV Example: Visual Search Engine CMV Example: cdv CMV Example: CommonGIS [Barsky et al. Cerebral: Visualizing Multiple Experimental Conditions on a Graph with [VSE from Boukhelfia, Roberts, and Rodgers, Figure 3 of State of the [CommonGIS from Andrienko and Andrienko, Figure 4 of State of the Biological Context. Proc. InfoVis 2008. p 1253-1260.] Art: Coordinated & Multiple Views in Exploratory Visualization. Roberts, Art: Coordinated & Multiple Views in Exploratory Visualization. Roberts, [cdv from Dykes, Figure 2 of State of the Art: Coordinated & Multiple Proc. CMV 2007] Proc. CMV 2007] 5 / 33 6 / 33 Views in Exploratory Visualization. Roberts, Proc. CMV 2007] 7 / 33 8 / 33 Replace, Replicate, Overlay Architectural Issues Improvise Coordinating Axes must play nicely with other views tightly integrated coordination approach when to do which scatterplot from components rendering, preprocessing, responding to commands components with many external control capabilities design tradeoffs most issues also true for scalability of single view always replace: too much reliance on memory always replicate: too many windows guaranteed response time independent of dataset size live properties always overlay: too much clutter in single window value slots, ports loose confederation change in response to user action multithreaded, each component can work in background naive approaches fall into cycles tighter confederation: return control to master regularly (TJ,H3) [ Fig 5. Weaver. Building Highly-Coordinated Visualizations In Improvise. Proc. InfoVis 2004, p. 159-166] divide work into pieces, enqueue continue serving queue when control is returned [ Fig 1. Weaver. Building Highly-Coordinated Visualizations In Improvise. Proc. InfoVis 2004, p. 159-166] 9 / 33 10 / 33 11 / 33 12 / 33 Coordinating Multiple Scatterplots Example: Complex Application Video Critique building up coordination strengths sync horizontal but not vertical scrolling encoding: same or multiform sophisticated and powerful approach to coordination dataset: same or small multiple weaknesses data: all or subset (overview/detail) large learning curve to build new apps background updating of views (upper left dot) list views for search coupled with other multiform views coordination analysis (controls/variables) selection decoupled from data [ Fig 6. Weaver. Building Highly-Coordinated Visualizations In Improvise. Proc. InfoVis 2004, p. 159-166] [ http://www.cs.ou.edu/ weaver/academic/publications/weaver-2004a- movie.zip ] [ Fig 2. Weaver. Building Highly-Coordinated Visualizations In Improvise. Proc. InfoVis 2004, p. 159-166] [ Fig 4. Weaver. Building Highly-Coordinated Visualizations In Improvise. 13 / 33 Proc. InfoVis 2004, p. 159-166] 14 / 33 15 / 33 16 / 33
Recommend
More recommend