Required Readings Further Reading Big Picture Metric-Based Network - - PowerPoint PPT Presentation

required readings further reading big picture
SMART_READER_LITE
LIVE PREVIEW

Required Readings Further Reading Big Picture Metric-Based Network - - PowerPoint PPT Presentation

Required Readings Further Reading Big Picture Metric-Based Network Exploration and Multiscale Scatterplot. Hyperdimensional Data Analysis Using Parallel Coordinates. covered so far Yves Chiricota, Fabien Jourdan, Guy Melancon. Proc. InfoVis


slide-1
SLIDE 1

Lecture 11: Tabular Data

Information Visualization CPSC 533C, Fall 2011 Tamara Munzner UBC Computer Science Mon, 17 October 2011 1 / 48

Required Readings

Metric-Based Network Exploration and Multiscale Scatterplot. Yves Chiricota, Fabien Jourdan, Guy Melancon. Proc. InfoVis 04, pages 135-142. Hierarchical Parallel Coordinates for Exploration of Large Datasets Ying-Huey Fua, Matthew O. Ward, and Elke A. Rundensteiner, IEEE Visualization ’99. Parallel sets: visual analysis of categorical data. Fabien Bendix, Robert Kosara, and Helwig Hauser. Proc. InfoVis 2005, p 133-140. 2 / 48

Further Reading

Hyperdimensional Data Analysis Using Parallel Coordinates. Edward J. Wegman. Journal of the American Statistical Association, Vol. 85, No. 411. (Sep., 1990), pp. 664-675. Parallel Coordinates: A Tool for Visualizing Multi-Dimensional
  • Geometry. Alfred Inselberg and Bernard Dimsdale, IEEE
Visualization ’90, 1990. 3 / 48

Big Picture

covered so far design levels problem, abstraction, encoding/interaction, algorithm methods taxonomy of visualization design concerns next stage: use these ideas for analysis and design analyze previously proposed techniques and systems design new techniques and systems me: this lecture as example (and graphs/trees) you: project proposal, topic presentations 4 / 48

Analysis Via Levels and Methods

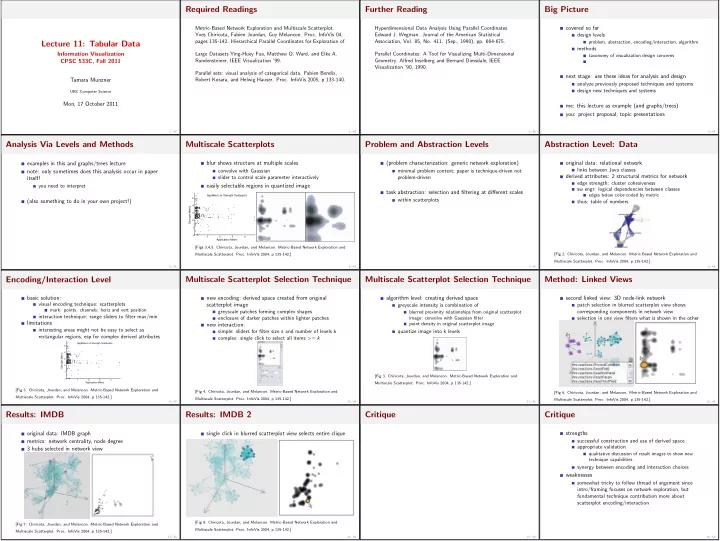
examples in this and graphs/trees lecture note: only sometimes does this analysis occur in paper itself! you need to interpret (also something to do in your own project!) 5 / 48

Multiscale Scatterplots

blur shows structure at multiple scales convolve with Gaussian slider to control scale parameter interactively easily selectable regions in quantized image AppMetric vs Strength Scatterplot 1 1 2 2 3 3 4 4 5 Strength Metric Application Metric [Figs 3,4,5. Chiricota, Jourdan, and Melancon. Metric-Based Network Exploration and Multiscale Scatterplot. Proc. InfoVis 2004, p 135-142.] 6 / 48

Problem and Abstraction Levels

(problem characterization: generic network exploration) minimal problem context; paper is technique-driven not problem-driven task abstraction: selection and filtering at different scales within scatterplots 7 / 48

Abstraction Level: Data

  • riginal data: relational network
links between Java classes derived attributes: 2 structural metrics for network edge strength: cluster cohesiveness sw engr: logical dependencies between classes edges below color-coded by metric thus: table of numbers [Fig 2. Chiricota, Jourdan, and Melancon. Metric-Based Network Exploration and Multiscale Scatterplot. Proc. InfoVis 2004, p 135-142.] 8 / 48

Encoding/Interaction Level

basic solution: visual encoding technique: scatterplots mark: points. channels: horiz and vert position interaction technique: range sliders to filter max/min limitations interesting areas might not be easy to select as rectangular regions, esp for complex derived attributes AppMetric vs Strength Scatterplot 1 1 2 2 3 3 4 4 5 Strength Metric Application Metric [Fig 3. Chiricota, Jourdan, and Melancon. Metric-Based Network Exploration and Multiscale Scatterplot. Proc. InfoVis 2004, p 135-142.] 9 / 48

Multiscale Scatterplot Selection Technique

new encoding: derived space created from original scatterplot image greyscale patches forming complex shapes enclosure of darker patches within lighter patches new interaction: simple: sliders for filter size s and number of levels k complex: single click to select all items >= k [Fig 4. Chiricota, Jourdan, and Melancon. Metric-Based Network Exploration and Multiscale Scatterplot. Proc. InfoVis 2004, p 135-142.] 10 / 48

Multiscale Scatterplot Selection Technique

algorithm level: creating derived space greyscale intensity is combination of blurred proximity relationships from original scatterplot image: convolve with Gaussian filter point density in original scatterplot image quantize image into k levels [Fig 3. Chiricota, Jourdan, and Melancon. Metric-Based Network Exploration and Multiscale Scatterplot. Proc. InfoVis 2004, p 135-142.] 11 / 48

Method: Linked Views

second linked view: 3D node-link network patch selection in blurred scatterplot view shows corresponding components in network view selection in one view filters what is shown in the other [Fig 6. Chiricota, Jourdan, and Melancon. Metric-Based Network Exploration and Multiscale Scatterplot. Proc. InfoVis 2004, p 135-142.] 12 / 48

Results: IMDB

  • riginal data: IMDB graph
metrics: network centrality, node degree 3 hubs selected in network view [Fig 7. Chiricota, Jourdan, and Melancon. Metric-Based Network Exploration and Multiscale Scatterplot. Proc. InfoVis 2004, p 135-142.] 13 / 48

Results: IMDB 2

single click in blurred scatterplot view selects entire clique [Fig 8. Chiricota, Jourdan, and Melancon. Metric-Based Network Exploration and Multiscale Scatterplot. Proc. InfoVis 2004, p 135-142.] 14 / 48

Critique

15 / 48

Critique

strengths successful construction and use of derived space appropriate validation qualitative discussion of result images to show new technique capabilities synergy between encoding and interaction choices weaknesses somewhat tricky to follow thread of argument since intro/framing focuses on network exploration, but fundamental technique contribution more about scatterplot encoding/interaction 16 / 48
slide-2
SLIDE 2

Hierarchical Parallel Coordinates

technique-driven paper (no problem characterization) scale up parallel coordinates to large datasets limitation: overplotting/occlusion [Figs 1,2. Fua, Ward, and Rudensteiner. Hierarchical Parallel Coordinates for Visualizing Large Multivariate Data Sets. IEEE Visualization 99.] 17 / 48

Parallel Coordinates: Basics

scatterplot limitation: vis enc with orthogonal axes
  • nly 2 attribs with spatial position channel in plane
instead, line up axes in parallel to show many attribs with position channel item shown with line with k segments (not as point) 18 / 48

Par Coord Tasks: Showing Correllation

pos corr: straight lines; neg corr: all cross at single point [Hyperdimensional Data Analysis Using Parallel Coordinates. Edward J. Wegman. Journal of the American Statistical Association, 85(411), Sep 1990, p 664-675.] 19 / 48

Par Coord Tasks: Showing Correllation

strong neg corr between two final axis pairs [Fig 1. Fua, Ward, and Rudensteiner. Hierarchical Parallel Coordinates for Visualizing Large Multivariate Data Sets. IEEE Visualization 99.] visible patterns only between neighboring axis pairs how to pick axis order? usual solution: reorderable axes, interactive exploration same weakness as many other techniques downside: human-powered search not directly addressed in HPC paper either 20 / 48

Hier Par Coords: Abstraction

data abstraction
  • riginal data: table of numbers
derived data: hierarchical clustering of items in table cluster stats: # points, mean, min, max, size, depth cluster density: points/size cluster proximity: linear ordering from tree traversal task abstraction finding correlations finding trends, outliers at multiple scales 21 / 48

HPC: Encoding Derived Data

vis enc: variable-width opacity bands show whole cluster, not just single item min/max: spatial position cluster density: transparency at mean point interpolate transparency between these [Fig 3. Fua, Ward, and Rudensteiner. Hierarchical Parallel Coordinates for Visualizing Large Multivariate Data Sets. IEEE Visualization 99.] 22 / 48

HPC: Interacting With Derived Data

interactively change level of detail to navigate cluster hier [Fig 4. Fua, Ward, and Rudensteiner. Hierarchical Parallel Coordinates for Visualizing Large Multivariate Data Sets. IEEE Visualization 99.] 23 / 48

HPC: Encoding Derived Data

vis enc: color based on cluster proximity derived attrib resolves ambiguity from crossings, clarifies structure [Fig 6. Fua, Ward, and Rudensteiner. Hierarchical Parallel Coordinates for Visualizing Large Multivariate Data Sets. IEEE Visualization 99.] 24 / 48

HPC: Magnification Interaction

dimensional zooming: use all available space method: linked view to show true extent [Fig 8. Fua, Ward, and Rudensteiner. Hierarchical Parallel Coordinates for Visualizing Large Multivariate Data Sets. IEEE Visualization 99.] 25 / 48

Critique

26 / 48

Critique

par coords strengths can be useful additional view (rare to use completely standalone) now popular, many follow-on technique refinements weaknesses major learning curve, difficult for novices hier par coords strengths success with major scalability improvement again, careful construction and use of derived space again, appropriate validation (result image discussion) weaknesses interface complexity (structure-based brushing) 27 / 48

Parallel Sets

technique-driven (problem char not main concern) data abstraction table with categorical (not quant) attributes discrete small number of distinct values
  • rdering between attribs not given
cross-tabulation (multi-way frequency/contingency table) task abstraction identify hotspots and major trends find relationships between dimensions and correlations between categories not outlier detection 28 / 48

Visual Encoding

like par coords but with boxes scaled by frequency values color coded by values for current active dimension [Fig 4. Bendix, Kosara, Hauser. Parallel sets: visual analysis of categorical data. Proc. InfoVis 2005, p 133-140.] 29 / 48

Visual Encoding

boxes can expand to show histograms [Fig 7. Bendix, Kosara, Hauser. Parallel sets: visual analysis of categorical data. Proc. InfoVis 2005, p 133-140.] 30 / 48

Interaction: Reordering

[Fig 5. Bendix, Kosara, Hauser. Parallel sets: visual analysis of categorical data. Proc. InfoVis 2005, p 133-140.] 31 / 48

Interaction: Aggregation

[Fig 5. Bendix, Kosara, Hauser. Parallel sets: visual analysis of categorical data. Proc. InfoVis 2005, p 133-140.] 32 / 48
slide-3
SLIDE 3

Interaction: Filtering

[Fig 5. Bendix, Kosara, Hauser. Parallel sets: visual analysis of categorical data. Proc. InfoVis 2005, p 133-140.] 33 / 48

Interaction: Highlighting

[Fig 5. Bendix, Kosara, Hauser. Parallel sets: visual analysis of categorical data. Proc. InfoVis 2005, p 133-140.] 34 / 48

Results: Case Study

corr between family type, city sizes, income, detergent? [Fig 5. Bendix, Kosara, Hauser. Parallel sets: visual analysis of categorical data. Proc. InfoVis 2005, p 133-140.] 35 / 48

Critique

36 / 48

Critique

strengths handles categorical, frequencies weaknesses/limits designed for few not many distinct values designed for few not many attributes 37 / 48

Synthesis

emphasis on derived spaces multiscale scatterplot, hier par coord extending scope of data handled hier par coord: handle more data parallel sets: handle different data all three designed to show all attribs in contrast to dimensionality reduction 38 / 48

Projects

programming problem-driven (design studies) technique-driven (new technique idea) implementation (of previously proposed technique) analysis survey team of two people requires scope*2 new this year: submit source code along with final report pre-proposal meetings: deadline in two days many already done (I signed off) still a few to do (deadline in two days) 39 / 48

Project Proposals I

http://www.cs.ubc.ca/ tmm/courses/533-11/projectdesc.html title (mandatory) names/email for people on team description of problem you’re targeting prob-driv: domain, task, dataset tech-driv: explain in terms of method taxonomy personal experience with this problem description of proposed solution prob-driv: data and task abstraction encoding and interaction techniques if refining/improving previous solution, also analyze that in same terms tech-driv: encoding and/or interaction techniques, in detail 40 / 48

Project Proposals II

scenario of use what user will do/see step by step in performing a task while using system must include illustrations proposed implementation approach high-level: platforms/language, toolkits if any big picture of what you code vs what toolkit supports
  • k to have set of alternatives if not narrowed down yet
schedule: milestones with target dates be specific not just generic (plan/code/writeup) think agile: get basics working early, then augment previous work not as complete as final, but you should have a start
  • ne per project due Oct 28 5pm as PDF by email
subject header: 533 submit proposal 41 / 48

Topic Presentations: Signing Up

topic list www.cs.ubc.ca/ tmm/courses/533-11/presentations.html choice can indeed be motivated by your project topic sign up by email by Fri 10/21 5pm required: three topic choices
  • ptional: one veto day that you do not want
Wed 11/9, Wed 11/23, Mon 11/28, Wed 11/30 I will post final topic/date assignments by Mon 10/31 might have two people split one topic if it’s popular I will post list of papers on topic 10 days in advance you pick 3 papers total, at least 1 must be from my list 42 / 48

Presentations

you present 3 papers in 25 minutes aim for 20 minutes presentation, 5 minutes questions grading criteria content summary: 50% you explain papers to people who have not read them you analyze the work w.r.t design levels and methods synthesis/critique: 20% for both individual papers, and across all three presentation style: 15% materials preparation: 15% slides required logistics you may use my laptop or yours if my laptop slides due 11am (PDF or PPT) if my laptop, check in advance for videos/demos 43 / 48

Presentations: Process Advice

bad idea: make slides; give talk in class 44 / 48

Presentations: Process Advice

bad idea: make slides; give talk in class good idea: start early and refine iteratively make slides practice talk out loud with timer realize it’s too long realize it’s too short realize what you forgot to put on slide realize why order of explanation is backwards realize where you need more pictures/diagrams realize where you haven’t figured out what to say refine slides loop back up to practice; repeat until great! 45 / 48

Presentations: Process Advice 2

tips on practicing always time it (whole thing; ideal slide by slide) best: give talk to somebody and get feedback at least once practice standing like giving real talk tips on slides ensure smallest text readable from back of room use color correctly (sufficient luminance contrast) early drafts often text-oriented; add pictures as refine tips on speaking talk loud enough that we can hear vary your tone of voice it gets better; practice makes it less scary lots more useful tips www.cs.ubc.ca/∼tmm/courses/533-11/ presentations.html#preparation 46 / 48

Reading For Next Time: NOTE CHANGE

Prefuse: A Toolkit for Interactive Information Visualization. Jeffrey Heer, Stuart K. Card, James Landay. Proc ACM CHI, 421-430, 2005. Protovis: A Graphical Toolkit for Visualization. Michael Bostock and Jeffrey Heer. IEEE Trans. Visualization & Computer Graphics (Proc. InfoVis), 2009. D3: Data-Driven Documents. Michael Bostock, Vadim Ogievetsky, Jeffrey Heer. IEEE Trans. Visualization & Computer Graphics (Proc. InfoVis), 2011. 47 / 48

Reminders

Project meetings due 10/19 this Wednesday No class next week (Oct 24/26) 48 / 48