
Representatjon of Ethnic Groups in Natjonal Legislatures Didier Ruedin University of the Witwatersrand & University of Neuchâtel 3 rd ISA Forum of Sociology Vienna, 12 July 2016
Ethnic groups are ofuen included 79% present in some way
Ethnic group representatjon is best measured using the Rose Index N ERS = 1 − 1 2 ∑ |Π Citizens,i −Π Representatives ,i | i = 1
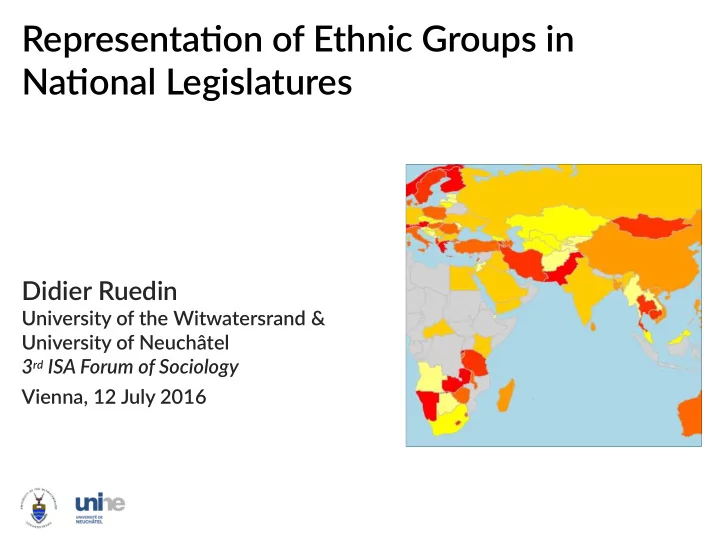
Ethnic groups are ofuen included Ethnic Representatjon Scores (ERS)
Many factors are thought to shape ethnic group representatjon Politjcal Context Citjzens Vote Choice Parliament Salience Electoral Cultural System, Candidates Élite Attjtudes Quotas Religion Politjcal Context Other Places Region t-1 Development Source: Ruedin (2013)
Same variables (don’t) work for 2006 and 2011 2006 2011
Ethnic quotas “do not” matuer Multjlevel, observatjons nested in countries, includes year dummies; world regions not shown here
Large difgerences across world regions Same models as previous slide
Changes in politjcal rights are not associated with changes in ethnic representatjon scores
In summary, cultural variables are not as important as they seemed Electoral system not dominant Large regional difgerences, but not clearly attjtudes to marginalized groups (noisy data)
Recommend
More recommend