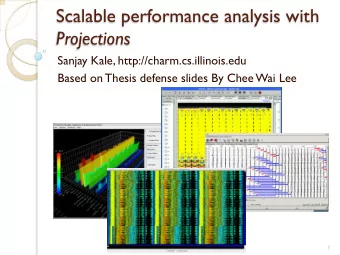
Projections: Scalable Performance Analysis and Visualization - PowerPoint PPT Presentation
Projections: Scalable Performance Analysis and Visualization Jonathan Lifflander, Laxmikant V. Kale { jliffl2 , kale } @illinois.edu University of Illinois Urbana-Champaign October 14, 2013 Programming Model Charm++ Work is decomposed
Projections: Scalable Performance Analysis and Visualization Jonathan Lifflander, Laxmikant V. Kale { jliffl2 , kale } @illinois.edu University of Illinois Urbana-Champaign October 14, 2013
Programming Model → Charm++ � Work is decomposed into objects that interact Projections: Scalable Performance Analysis and Visualization � Jonathan Lifflander � 2 / 27 Projections:
Programming Model → Charm++ � Work is decomposed into objects that interact � Objects are logical, location-oblivious entities Projections: Scalable Performance Analysis and Visualization � Jonathan Lifflander � 2 / 27 Projections:
Programming Model → Charm++ � Work is decomposed into objects that interact � Objects are logical, location-oblivious entities � Runtime maps them to a processor ◮ May migrate them during execution due to dynamic load imbalance Projections: Scalable Performance Analysis and Visualization � Jonathan Lifflander � 2 / 27 Projections:
Programming Model → Charm++ � Work is decomposed into objects that interact � Objects are logical, location-oblivious entities � Runtime maps them to a processor ◮ May migrate them during execution due to dynamic load imbalance � Method invocation between objects causes communication if the objects are not in the same memory domain Projections: Scalable Performance Analysis and Visualization � Jonathan Lifflander � 2 / 27 Projections:
Programming Model → Charm++ � Work is decomposed into objects that interact � Objects are logical, location-oblivious entities � Runtime maps them to a processor ◮ May migrate them during execution due to dynamic load imbalance � Method invocation between objects causes communication if the objects are not in the same memory domain � Communication is asynchronous and drives the computation Projections: Scalable Performance Analysis and Visualization � Jonathan Lifflander � 2 / 27 Projections:
Programming Model → Charm++ � Work is decomposed into objects that interact � Objects are logical, location-oblivious entities � Runtime maps them to a processor ◮ May migrate them during execution due to dynamic load imbalance � Method invocation between objects causes communication if the objects are not in the same memory domain � Communication is asynchronous and drives the computation � Runtime system schedules which method to execute next (based on messages that have arrived) Projections: Scalable Performance Analysis and Visualization � Jonathan Lifflander � 2 / 27 Projections:
Charm++ → Collections of Objects � Often communication patterns can be represented nicely by interactions between a collection of elements Projections: Scalable Performance Analysis and Visualization � Jonathan Lifflander � 3 / 27 Projections:
Charm++ → Collections of Objects � Often communication patterns can be represented nicely by interactions between a collection of elements � Objects can be organized into typed, indexed collections ◮ Dense ◮ Sparse ◮ Multi-dimensional (1d-6d) ◮ Elements can be dynamically inserted into or deleted Projections: Scalable Performance Analysis and Visualization � Jonathan Lifflander � 3 / 27 Projections:
Charm++ → Collections of Objects Processor 1 Processor 2 C[0,0] B[3] C[0,2] B[3] C[0,2] C[0,0] A[2] C[1,4] A[1] A[2] C[1,4] A[1] C[1,0] A[0] A[0] C[1,2] C[1,0] B[0] C[1,2] B[0] Scheduler Location Manager Scheduler Location Manager Processor 3 Processor 4 Projections: Scalable Performance Analysis and Visualization � Jonathan Lifflander � 4 / 27 Projections:
Challenges � Many more objects than processors ◮ Anywhere from tens to hundreds per processor � Fine-grained resolution of events ◮ May be as small as tens of microseconds per event � Logical entities (objects) are distinct from physical (processors) ◮ Mapping may change over time Projections: Scalable Performance Analysis and Visualization � Jonathan Lifflander � 5 / 27 Projections:
Charm++ � Most of the code is written in C++ � Parallel objects have a corresponding parallel interface in a .ci file � The .ci file is translated to C++ code ◮ We have some compiler level support we can leverage Projections: Scalable Performance Analysis and Visualization � Jonathan Lifflander � 6 / 27 Projections:
Methodology → Event Tracing � Trace-based instrumentation of events ◮ Certain methods in the system are marked as entry methods ⋆ Meaning they can be invoked remotely ⋆ These remote methods are automatically traced by the system ◮ Messages sent and received ◮ System events ⋆ Certain scheduler-level events or system states are recorded: processor idleness, communication overhead, message serialization, etc. Projections: Scalable Performance Analysis and Visualization � Jonathan Lifflander � 7 / 27 Projections:
User Intervention → Event Tracing � Language gives flexibility to the user ◮ Methods can be annotated by the notrace attribute, which causes the code generation to eliminate tracing overhead altogether ◮ Non-entry methods (not traced by default), can be annotated as local to automatically add tracing � API provides further control to the programmer ◮ Turn tracing on or off ⋆ On a subset of the processors or objects ⋆ During some times ◮ Register user-defined functions for tracing ◮ Trace point events or bracketed events (register name and then call API when it occurs) ◮ Save memory usage at a point in the program execution Projections: Scalable Performance Analysis and Visualization � Jonathan Lifflander � 8 / 27 Projections:
Charm++: Runtime Data Collection � Charm++ has several strategies built-in that have varying data/memory overheads ◮ Full tracing ⋆ An event is composed of the time, sending/receiving processor, entry method, object, etc. ⋆ Each event is logged per processor in memory and then is incrementally written to disk ◮ Summary ⋆ Each processor is allotted a fixed number of equally sized time bins that hold averages over the time range Projections: Scalable Performance Analysis and Visualization � Jonathan Lifflander � 9 / 27 Projections:
Projections � Research on this began in 1992 � Java-based visualization tool that reads traces (summary or full) � Supports many different ways of visualizing the data � Scaling ◮ Tested with over 100k cores ◮ It is multi-threaded and has been optimized for memory usage � How to use it ◮ Download the .jar, works out of the box with Charm++ ◮ Link with the flag -tracemode projections ◮ git://charm.cs.uiuc.edu/projections.git � Support beyond Charm++ ◮ We are actively improving the prototyped MPI tracing layer ◮ Support for Global Arrays exists in alpha form Projections: Scalable Performance Analysis and Visualization � Jonathan Lifflander � 10 / 27 Projections:
Timeline Projections: Scalable Performance Analysis and Visualization � Jonathan Lifflander � 11 / 27 Projections:
Timeline → NAMD: Apoa1 system, 92k atoms, 32k cores, about 3 atoms per core! Projections: Scalable Performance Analysis and Visualization � Jonathan Lifflander � 12 / 27 Projections:
Time Profile → NAMD: Apoa1 system, 92k atoms, no communication thread Projections: Scalable Performance Analysis and Visualization � Jonathan Lifflander � 13 / 27 Projections:
Time Profile → NAMD: Apoa1 system, 92k atoms, with communication thread Projections: Scalable Performance Analysis and Visualization � Jonathan Lifflander � 14 / 27 Projections:
Histogram → NAMD: Apoa1 system, 92k atoms, 1-away decomposition Projections: Scalable Performance Analysis and Visualization � Jonathan Lifflander � 15 / 27 Projections:
Histogram → NAMD: Apoa1 system, 92k atoms, 2-away decomposition Projections: Scalable Performance Analysis and Visualization � Jonathan Lifflander � 16 / 27 Projections:
Time Profile → NAMD: Apoa1 system, 92k atoms, with communication thread Projections: Scalable Performance Analysis and Visualization � Jonathan Lifflander � 17 / 27 Projections:
Usage Profile Projections: Scalable Performance Analysis and Visualization � Jonathan Lifflander � 18 / 27 Projections:
Communication Over Time Projections: Scalable Performance Analysis and Visualization � Jonathan Lifflander � 19 / 27 Projections:
Outlier/Extrema View Projections: Scalable Performance Analysis and Visualization � Jonathan Lifflander � 20 / 27 Projections:
Timeline → Colored by memory for LU Projections: Scalable Performance Analysis and Visualization � Jonathan Lifflander � 21 / 27 Projections:
Profile Memory Scatter Projections: Scalable Performance Analysis and Visualization � Jonathan Lifflander � 22 / 27 Projections:
Profile Memory Scatter Projections: Scalable Performance Analysis and Visualization � Jonathan Lifflander � 23 / 27 Projections:
Demo Projections: Scalable Performance Analysis and Visualization � Jonathan Lifflander � 24 / 27 Projections:
Recommend
More recommend
Explore More Topics
Stay informed with curated content and fresh updates.
