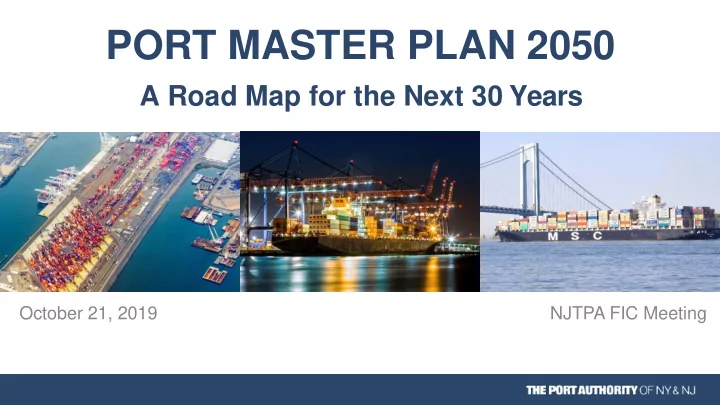
PORT MASTER PLAN 2050 A Road Map for the Next 30 Years **Hatch: Please provi de images used on GID pr esentation title page. Also please provide r eplace image of 1 WTC wi th something different (too controversial) October 21, 2019 NJTPA FIC Meeting
The Port Master Plan Is and Is Not… Consistent Holistic A Framework Near and Long Provides a framework of Provides near and long-term Ensures future development Helps integrate Port facilities potential options and a strategies toensure delivery is consistentwith goals and into a transportation network guide for future land use of needed infrastructure policies decisions Commercial Economic Change-Based Flexible Facilitates commerce Supports long-term Considers changes in shipping, Adapts to changes inthe and business growth economic benefits to the population, environmental baseline assumptions and region, including jobs and impacts and technological provides flexibility over time tax revenue advances …and implementation Definitive Final will require design, permits, Not absolute in its Not the final plan for all recommendations development over the next outreach and authorization 30 years 2
Current State of the Port Key Statistics: Port Department Facilities Acres 3,000+ Port Newark 846 Elizabeth PAMT 1,124 Howland Hook MT 279 Port Jersey PAMT 419 Brooklyn PAMT 151 Tenants ~60 Cargo Volumes 7.2 million 645,760 3.6 million 573,035 856,271 (2018) Containers (TEU) By Rail (Lifts) Dry Bulk (Tons) Autos (Units) Cruise (Passengers) 3
PONYNJ Benefits LOCATION • Located in the middle of the largest consumer markets in one of the most affluent parts of the world reated Maha ah ro the No n Pro e t • Greatest port reach on the East Coast. 45 million people within 4 ho rs’ drive, 1/3 o the nation’s DP • Access to 125 million people within a 36-hour drive CONNECTIVITY AND SUPPORTING INDUSTRIES • Direct access to major road and rail networks. • Over 1 billion square feet of warehouses and distribution centers within 50 miles of port. • More first port of call services than any other East Coast port INVESTMENT • Significant private and public sector investment to support future growth reated re or resnar ro the No n Pro e t 4
Port Master Plan Process 4Q/2016 – 2Q/2017 3Q/2017 4Q/2017 1Q/2018 - 2Q/2019 1 2 3 4 Write Plan, Analyze Develop Market, Review Gather Key and Land Data, Project Feedback Assess Use and Goals and and Present Options Capacity Visions Final Stakeholder Outreach PANYNJ Workshops 5
Port Master Plan 2050 Vision Create a flexible roadmap to develop a competitive, financially successful port, maximizing regional jobs and economic impacts, and minimizing environmental effects Sustainable and A Platform for Shaping An Economic State of the Art Resilient Partnership Future Growth Generator …with technology, …leadin by example, …with increased jobs …with communities, …a o odatin the safety and data the Port Authority will on the Port and in the customers, operators, future needs of shippers, management at the continue to drive down region, enabling small shippers, logistics rationalizing land uses, heart of improved carbon emissions, and large businesses providers, and potential consolidating operations. minimize noise, to thrive and providing investors all actively containers, autos, and congestion and opportunities for involved in decision- bulk, and partnering to environmental impacts training, job creation making and improve regional rail, at its facilities and and entrepreneurship. implementation. road, and off-site throughout the Port of facilities. New York and New Jersey. 6
Port Master Plan Engagement and Outreach 45+ STAKEHOLDERS INCLUDED Total Presentations to Regional Stakeholders and NY & NJ Elected Officials Community Groups Current Tenants Transportation Authorities and Rail and Terminal Operators Planning Agencies 50+ Federal, State, and Local Agencies Commercial Real Estate & Planning Workshops, Harbor Pilots Property Management Groups Interviews, and Activities Shipping and Labor Management Technology Leaders Associations Academic Institutions 400+ Labor Environmental Justice Groups Stakeholders across Trucking and Logistics Companies New York & New Jersey Host Communities 7
Containers Market Forecast (TEU) 20.0 Trends and Millions 15.0 Emerging Issues 10.0 5.0 • Container volumes 0.0 0 5 10 15 20 25 30 are projected to Years double or triple by Low High 2050 • Ocean carrier Estimated Leasehold Acreage Design Vessel consolidation and Capacity 18,000 TEU Present 2050 alliances Class ULCV 1,779 – 1,815 • Vessel size Acres 1,649 Length (LOA) 399 m (1,310 ft) increasing rapidly Beam (max) 54 m (177 ft) • Use of real-time Draft 16 m (52 ft) decision making and other technologies Air Draft (est.) 59 m (194 ft) 8
Market Forecast (CEU) Autos 1.5 Trends and Millions 1.0 Emerging Issues 0.5 0.0 • Auto volumes 0 5 10 15 20 25 30 remain strong Years • Mobility as an on- Low High demand service • Autonomous Estimated Leasehold Acreage Design Vessel vehicles 9,000 – 10,000 CEU Capacity Present 2050 • Electric and hybrid Class PCTC Acres 291 390 vehicles Length (LOA) 265 m (869 ft) Beam (max) 42 m (138 ft) Draft 13 m (43 ft) Air Draft (est.) 52 m (171 ft) 9
Market Forecast (Tons) Bulk 6.0 Trends and Millions 4.0 Emerging Issues 2.0 • Bulk volumes 0.0 0 5 10 15 20 25 30 remain strong Years • Offshore wind and Low High other renewable energy sources Estimated Leasehold Acreage Design Vessel • LNG bunkering Capacity 80,000 DWT Present 2050 • Additive Class Panamax 179 – 281 Acres 160 manufacturing (i.e. Length (LOA) 290 m (950 ft) 3D printing) Beam (max) 32.3 m (106 ft) • Beneficial use of Draft 14.6 m (47.9 ft) recycled Air Draft (est.) 40 m (132 ft) commodities 10
Market Forecast (Pax) Cruise 3.0 Trends and Millions 2.0 Emerging Issues 1.0 0.0 • Consistent growth 0 5 10 15 20 25 30 in passenger Years volumes Low High • Increasing vessel size Estimated Leasehold Acreage Design Vessel • NY/NJ as port of Capacity 5,400 pax Present 2050 call Class Oasis Class Acres No change Length (LOA) 362 m (1,188 ft) Beam (max) 65.5 m (215 ft) Draft 9.1 m (30 ft) Air Draft (est.) 57 m (187 ft) 11
Intermodal Rail Market Forecast (Lifts) 4.0 Trends and Millions 3.0 Emerging Issues 2.0 1.0 • Potential demand 0.0 0 5 10 15 20 25 30 for inland port Years facilities Low High • Need for additional off-terminal Estimated Leasehold Acreage Design Vessel facilities (including Capacity Present 2050 storage tracks) Class (included in container • Discretionary Acres leaseholds) Length (LOA) market opportunity Not Applicable Beam (max) Draft Air Draft (est.) 12
Other Emerging Trends and Issues Trucking and Logistics Infrastructure and Terminals • • Truck data capture Kill Van Kull channel becomes a greater constraint without mitigation • Shared chassis pools and empty • container depots Modal split has opportunity to increase, including rail and marine • Autonomous trucking and platooning highway (barge) • Driver supply • Tenants want to invest in capacity to • Intelligent transportation systems (ITS) support growth • Digitization of information streams 13
Current Container Capacity of Port <5% 75-80% Elizabeth + ~10% Newark ~10% 14
Current Container Capacity vs. Forecast Demand 20 GROWTH BASED ON DISCRETIONARY FOCUS 17M TEU Container Throughput (million TEU) 16 EXISTING BASELINE 12 CAPACITY 12M TEU 8 GROWTH BASED ON LOCAL MARKET FOCUS 4 0 0 5 10 15 20 25 30 Year 15
Forecast of PONYNJ Container Fleet Vessel Size Ever- Larger Vessels → Long - Term Decrease in Vessel Calls → Less Pollution CMA CGM T. Roosevelt (14,414 TEU) actual Anticipated to peak at 18,000 TEU 16
Port Truck Distribution Primary destinations (first stop) for Port truck traffic (top 4 counties account for almost 75% of trucks) reated reative tall ro the No n Pro e t Interstate highways, showing major routes for Port trucks and peak traffic congestion reated reative tall ro the No n Pro e t 17
Port Truck Distribution Primary destinations (first stop) for Port truck traffic (top 4 counties account for almost 75% of trucks) reated reative tall ro the No n Pro e t Interstate highways, showing major routes for Port trucks and peak traffic congestion reated reative tall ro the No n Pro e t Key east-west corridors: I-78 and I-80 (along with I-280 and NJ 24) Key north-south corridors: I-95, I-287 and NJ 17 18
Port Master Plan 2050 19
Phase 1 The First 15 Years 20 20
Recommend
More recommend
Unleash a World of Digital Possibilities—Browse, Share, and Explore Content Without Boundaries