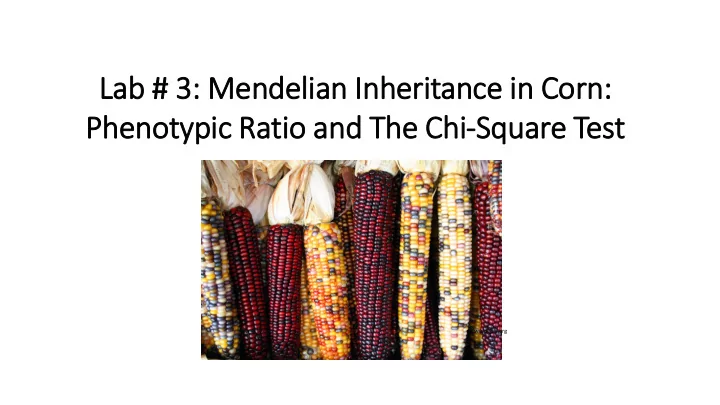

Lab # 3: : Mendelian In Inheritance in in Corn: Phenotypic ic Ratio io and The Chi-Square Test en.wikipedia.org
In Previous Labs.. 1. The Principle of Segregation and the Principle of Independent Assortment. 2. Gene Interactions: recessive epistasis, dominant epistasis, complementary gene action Today’s Objectives 1. To explore how Mendel’s principles can explain transmission of characters from one generation to the next. 2. To understand and perform the Chi-square statistical test to evaluate hypotheses about mechanisms of inheritance.
Corn: Genes and Phenotypes RRSuSu rrsusu Kernel (F2)
Corn: Genes and Phenotypes C and R C l and R Pr and R Phenotypic ratio?
Observed and Expected Values Grain Expected Expected Observed Phenotype Ratio Number Number Purple & 9/16 * 381 = A 9/16 216 Smooth 214.31 Purple & 3/16 * 381 = B 3/16 79 Shrunken 71.43 Yellow & 3/16 * 381 = C 3/16 65 Smooth 71.43 Yellow & 1/16 * 381 = D 1/16 21 Shrunken 23.81 Total 381 Number: Can we consider observed and expected values to be the same?
The Chi-Square Test • The chi square test is designed to test the statistical significance of an experimental outcome. • We use the Chi-square test to compare observed data with the data we would expect to obtain according to our hypothesis (=Mendelian ratios). • Null hypothesis – observed values are not different from the expected values • Alternative hypothesis – observed values are different from expected values
The Chi-Square Test Grain Expected Expected Observed Phenotype Ratio Number Number S c 2 = (observed – expected) 2 A Purple & 9/16 * 381 9/16 216 Smooth = 214.31 Purple & 3/16 * 381 B number expected 3/16 79 Shrunken = 71.43 Yellow & 3/16 * 381 C 3/16 65 Smooth = 71.43 Yellow & 1/16 * 381 1/16 21 D Shrunken = 23.81 Total 381 Number: c 2 = (216-214.31) 2 / 214.31 + (79-71.43) 2 / 71.43 + (65-71.43) 2 / 71.43 + (21-23.81) 2 / 23.81 = 0.97
Chi-Square Table of Critical Values c 2 = 0.97 df c 2 values
Degrees of Freedom df = # observations which are free to vary Tue Mon Thu Sat Sun Fri Wed Total # of hats (n) = 7 # of hats which are free to vary = 6 df = n-1 # of hats which are not free to vary (must wear them) = 1 n = # of classes (e.g., phenotypes) df = 4 - 1 = 3
Chi-Square Table of Critical Values c 2 = 0.97 df = 3 df 0.97 c 2 values
Concluding Questions 1. Purple color in corn kernels: • dominant • recessive 2. Starchy kernels: • dominant • recessive 3. Which hypothesis do we test using the Chi-square test? • null hypothesis • alternative hypothesis
Recommend
More recommend