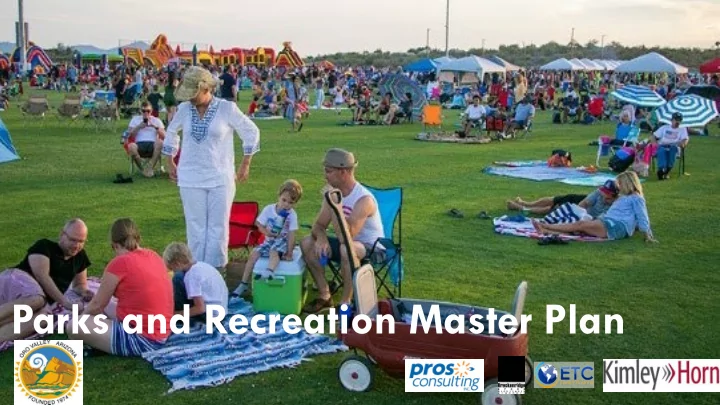

Parks and Recreation Master Plan Inspiring communities to action
Agenda • Influencing Factors • Focus Group and Stakeholder Key Themes • Website Participation • Intercept Survey • Online Survey • Statistically Valid Survey • Prioritized Needs • Next Steps
Influencing Factors
• Town Average Annual Growth rate = 1% Population • US Average Annual Growth Rate = 0.8%
• Today, 48.7% of the population is 55+ • By 2034, 58.1% of population will be 55+ Age Segmentation
• Culture often influences park and recreation experiences Ethnicity
COMPARATIVE INCOME CHARACTERISTICS Higher Income Levels. Per Capita Income Median Household Income Provide high quality $85,173 experiences with a focus on cost recovery $58,100 $54,974 $49,475 $31,950 $28,634 Income Oro Valley Arizona U.S.A.
Holistic and Continuous Public Input
Collaborative Planning Focus Group and Project Website Town Hall Meetings Community Outreach Surveys
Focus Group/Town Hall Meeting – Key Themes • Strong Advocacy and Appreciation for the System • Economic Development through Park Development • Invest in Existing Park System • Open Space Preservation • Trails, Trails, Trails • Financial Strategies to maintain and grow the system
Project Website www.planyourparksov.com/
Website Participation and Key Themes The website has generated 926+ comments since January
Intercept Surveys • Purpose: Prioritize Importance of Park and Recreation Facilities and Amenities • Administered by Consulting Team and Parks and Recreation Advisory Board • February 7 th – March 16 th , 2020 • Nine dates and times at various locations and events • Total of 404 participants
Intercept Survey Feedback
Online Survey • Administered via Survey Monkey • Developed in partnership with the Town • April 20 – May 3, 2020 • Total of 372 completed surveys • 4,451 residents represented by the 372 completed surveys
On-Line Survey Priorities
Statistically Valid Survey
Statistically-Valid Survey • Only scientific and defensible method to understand community needs • Administered by mail/phone/web • Developed in partnership with the Town • Methodology allows high return rate (25%-35%) • Total of 443 completed surveys, 95% level of confidence with a margin of error of +/- 4.6% (Goal was 375)
Survey Response Location Map
Advocacy
Park and Facility Visitation and Condition
Ninety-five percent (95%) of Oro Valley’s parks and recreation facilities were given a condition rating that exceeded the national benchmark for excellent of 29%.
Program Participation and Quality
The national benchmark for program participation is 33%.
Fair Good Excellent Poor The national benchmark for excellent is 33%.
The national benchmark for too busy/not interested is 32% and for not knowing what is offered is 35%.
Recreation Program and Activity Needs
National Benchmarks • Community special events - 21% • Senior programs and services 16% • Adult fitness programs – 48% • Adult learning classes 14%
Park, Facility and Amenity Needs
National Benchmarks • Walking and biking trails (multi-use paved) 45% • Walking & hiking trails (natural surface) 33% • Open Space Conservation Areas/Trails – 24% • Golf - 9%
Public Support
Community Needs
Needs Analysis Methodology This model evaluates both quantitative and qualitative data. • Quantitative data includes the local demographics, recreation trends, statistically valid survey and the on-line. • Qualitative data includes community input via stakeholder interviews, staff input, intercept surveys, the project website, and planning team observations. • A weighted scoring system is used to determine the priorities for facilities and programs and services • The results of the priority ranking are tabulated into three categories: High Priority , Medium Priority , and Low Priority . 43
Recreation Programs and Services Prioritized Needs Recreation Program/Service Priority Water fitness programs/lap swimming Recreation Program/Service Priority Weightlifting/bodybuilding programs Running events Community special events ‐ ‐ Reservation/rental of picnic shelters Fitness & wellness programs High Adult learning classes After school programs/out of school camps ‐ Senior programs & services Tennis lessons & leagues Art classes Family oriented programs Bicycle lessons & clubs Learn to swim programs Volleyball programs Soccer programs Recreation Program/Service Priority Low Programs for people with special needs Reservation/rental of indoor meeting space Walking/jogging/running/cycling clubs Performing arts programs Archery Golf lessons/clinics Basketball programs Medium Environmental education programs Sand volleyball programs Pickleball lessons/clinics Recreation/competitive swim team Open swim Gymnastics Softball programs Reservation/rental of athletic fields Football programs Baseball programs Lacrosse programs
Next Steps
Next Steps June – October/November • Park Level of Service Standards and Geographical Analysis through Mapping • Recreation Programming Assessment and Operational Funding Analysis • Capital Improvement Plan • Funding and Revenue Strategies for Capital Improvement Plan • Strategic Action Plan Development • Final Master Plan Development
Recommend
More recommend