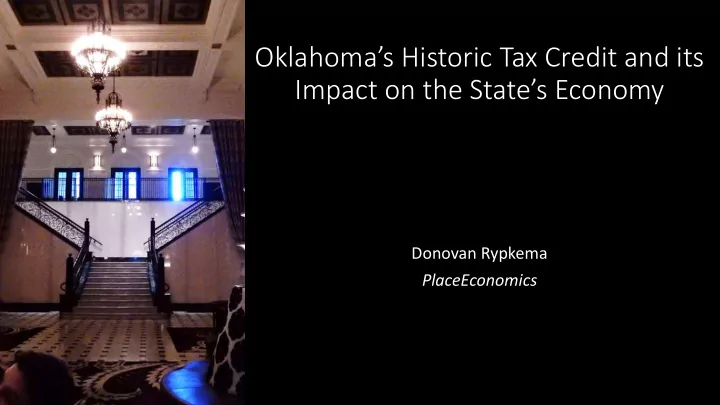

Oklahoma’s Historic Tax Credit and its Impact on the State’s Economy Donovan Rypkema PlaceEconomics
Tests of a good economic develo lopment in incentiv ive 1. The incentive achieves the purposes for which it was create 2. There are measurable economic development benefits 3. The incentive significantly leverages private investment 4. The use of the incentive meets the “but for” test The best economic development incentives meet an additional test: 5. There are significant benefits of the incentive beyond just economic development
The Oklahoma Historic Tax Credit meets ALL ALL of those tests
If you can’t write your idea on the back of my business card, you don’t have a clear idea. • 77 historic rehabilitation projects were completed between 2001 and 2015 representing investment of more than $500 million. • Every $1 of State Tax Credit catalyzes $11.70 in economic activity in Oklahoma. • Tax credit projects have generated paychecks of nearly $310 Million for Oklahoma workers. • The State of Oklahoma gets back over half their tax credit expenditure before the credit is even awarded. • On average there has been 25% more invested in these projects than qualified for the tax credit
Oklahoma Tax Credit Projects 2001 - 2015 $100,000,000 14 $90,000,000 12 $80,000,000 10 $70,000,000 $60,000,000 8 $50,000,000 6 $40,000,000 $30,000,000 4 $20,000,000 2 $10,000,000 $0 0 2001 2002 2003 2004 2005 2006 2007 2008 2009 2010 2011 2012 2013 2014 2015 Amount of QRE Additional Investment Number of Projects
Cumulative Investment Tax Credit Projects $600,000,000 $500,000,000 $400,000,000 $300,000,000 $200,000,000 $100,000,000 $0 2001 2002 2003 2004 2005 2006 2007 2008 2009 2010 2011 2012 2013 2014 2015 QRE Additional Investment
Project Numbers by Location 29.9% 46.8% 23.4% Oklahoma City Tulsa Elsewhere in Oklahoma
Tax Credit Projects by Size 16% 17% Less than $200,000 $200,000 - $500,000 $500,000 - $1,000,000 12% 18% $1,000,000 - $2,000,000 $2,000,000 - $5,000,000 $5,000,000 - $10,000,000 More than $10,000,000 18% 10% 9%
Projects under Projects between Projects over $1 million $1 million-$10 million $10 million Oklahoma City Ada Oklahoma City Tulsa Tulsa Tulsa Perry Oklahoma City Guthrie Bartlesville Drumright Sapulpa Edmond Norman Ardmore Idabel Pawhuska Muskogee Bristow Enid Anadarko Shawnee Watonga Cordell Jones
Location of Projects by Investment $46,555,002 $242,870,780 $230,896,359 Oklahoma City Tulsa Rest of Oklahoma
Historic Tax Credit Project Use Residential Mixed Use 26% 34% 25% 9% 6% Office Commercial Hotel 0% 20% 40% 60% 80% 100%
Jobs from Tax Credit Projects 1,300 1,200 1,100 1,000 900 800 700 600 500 400 300 200 100 0 2001 2002 2003 2004 2005 2006 2007 2008 2009 2010 2011 2012 2013 2014 2015 Total Jobs Direct Total Jobs Indirect & Induced
Salaries and Wages from Tax Credit Projects $60,000,000 $55,000,000 $50,000,000 $45,000,000 $40,000,000 $35,000,000 $30,000,000 $25,000,000 $20,000,000 $15,000,000 $10,000,000 $5,000,000 $0 2001 2002 2003 2004 2005 2006 2007 2008 2009 2010 2011 2012 2013 2014 2015 Labor Income Direct Labor Income Indirect & Induced
If the average historic preservation tax credit activity over the last 15 years were a single industry, it would be among the largest 5% of firms in Oklahoma
Jobs/$1,000,000 Output Direct, Indirect, Induced Beef cattle ranching and farming, including feedlots… Hotels and motels, including casino hotels Building Rehabilitation Truck transportation New Construction Data processing, hosting, and related services Software publishers Drilling oil and gas wells Telecommunications Carriers Biological product manufacturing Petroleum refineries 0 2 4 6 8 10 12 14 16 18
Salary and Wages/$1,000,000 Output Direct, Indirect, Induced Truck transportation Building Rehabilitation New Construction Drilling oil and gas wells Data processing, hosting, and related services Hotels and motels, including casino hotels Software publishers Biological product manufacturing Telecommunications Carriers Petroleum refineries Beef cattle ranching and farming $0 $150,000 $300,000 $450,000 $600,000 $750,000
Effect of $100,000 Historic Tax Credit $600,000.00 $500,000.00 $400,000.00 $300,000.00 $200,000.00 $100,000.00 $0.00 -$100,000.00 State Tax Credit QRE Investment Additional Investment Indirect/Induced Economic Activity
Initial Returns to the State of Oklahoma before Credit is Rewarded (per $100,000 in credits) Personal Income Tax $19,537 Business Income Tax $6,556 State Sales Tax $25,560
The “salability” of the Oklahoma Historic Tax credit are a major advantage. In other states $.65 to $.75 on the $1.00 is a typical selling price. In Oklahoma developers are getting $.80 to $.90
Your friends to the south.
Five Years Prior to Tax Credit Texas, $300,000,000 $268,161,054 $250,000,000 $200,000,000 $150,000,000 Oklahoma, $100,000,000 $17,391,442 $50,000,000 $0 Texas Oklahoma
Most Recent Five Years $300,000,000 Texas, $194,969,209 $250,000,000 $200,000,000 Oklahoma, $150,000,000 $222,602,306 $100,000,000 $50,000,000 $0 Texas Oklahoma
Historic Preservation Investment Oklahoma vs Texas $300,000,000 $250,000,000 $200,000,000 $150,000,000 $100,000,000 $50,000,000 $0 Five Years Prior to Tax Credit Most Recent Five Years Texas Oklahoma
Congratulations, Oklahoma, for having one of the best Historic Tax Credit programs in America Thank you very much
Recommend
More recommend