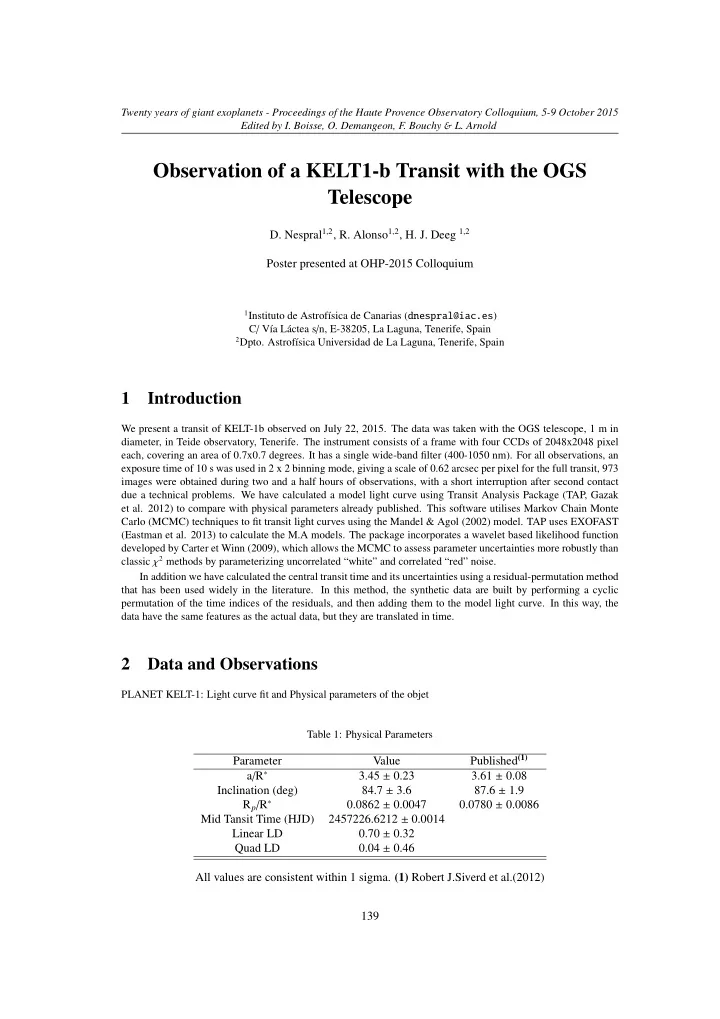

Twenty years of giant exoplanets - Proceedings of the Haute Provence Observatory Colloquium, 5-9 October 2015 Edited by I. Boisse, O. Demangeon, F. Bouchy & L. Arnold Observation of a KELT1-b Transit with the OGS Telescope D. Nespral 1 , 2 , R. Alonso 1 , 2 , H. J. Deeg 1 , 2 Poster presented at OHP-2015 Colloquium 1 Instituto de Astrof´ ısica de Canarias ( dnespral@iac.es ) C / V´ ıa L´ actea s / n, E-38205, La Laguna, Tenerife, Spain 2 Dpto. Astrof´ ısica Universidad de La Laguna, Tenerife, Spain 1 Introduction We present a transit of KELT-1b observed on July 22, 2015. The data was taken with the OGS telescope, 1 m in diameter, in Teide observatory, Tenerife. The instrument consists of a frame with four CCDs of 2048x2048 pixel each, covering an area of 0.7x0.7 degrees. It has a single wide-band filter (400-1050 nm). For all observations, an exposure time of 10 s was used in 2 x 2 binning mode, giving a scale of 0.62 arcsec per pixel for the full transit, 973 images were obtained during two and a half hours of observations, with a short interruption after second contact due a technical problems. We have calculated a model light curve using Transit Analysis Package (TAP, Gazak et al. 2012) to compare with physical parameters already published. This software utilises Markov Chain Monte Carlo (MCMC) techniques to fit transit light curves using the Mandel & Agol (2002) model. TAP uses EXOFAST (Eastman et al. 2013) to calculate the M.A models. The package incorporates a wavelet based likelihood function developed by Carter et Winn (2009), which allows the MCMC to assess parameter uncertainties more robustly than classic χ 2 methods by parameterizing uncorrelated “white” and correlated “red” noise. In addition we have calculated the central transit time and its uncertainties using a residual-permutation method that has been used widely in the literature. In this method, the synthetic data are built by performing a cyclic permutation of the time indices of the residuals, and then adding them to the model light curve. In this way, the data have the same features as the actual data, but they are translated in time. 2 Data and Observations PLANET KELT-1: Light curve fit and Physical parameters of the objet Table 1: Physical Parameters Published (1) Parameter Value a / R ∗ 3.45 ± 0.23 3.61 ± 0.08 Inclination (deg) 84.7 ± 3.6 87.6 ± 1.9 R p / R ∗ 0.0862 ± 0.0047 0.0780 ± 0.0086 Mid Tansit Time (HJD) 2457226.6212 ± 0.0014 Linear LD 0.70 ± 0.32 Quad LD 0.04 ± 0.46 All values are consistent within 1 sigma. (1) Robert J.Siverd et al.(2012) 139
Twenty years of giant exoplanets - Proceedings of the Haute Provence Observatory Colloquium, 5-9 October 2015 Edited by I. Boisse, O. Demangeon, F. Bouchy & L. Arnold Figure 1: Light curve of KELT-1 overplotted with its best-fit from MCMC analysis. The residuals from the best-fit model are shown below light curve. Table 2: Estimating error parameters: Residual-Permutation method Parameter Value Error MCMC Error Residual-Permutation Mid Tansit Time (HJD) 2457226.6212 0.0014 0.0047 R p / R ∗ 0.0862 0.0047 0.0055 Inclination (deg) 84.7 3.6 4.3 a / R ∗ 3.45 0.23 0.24 Linear LD 0.70 0.32 .42 Quad LD 0.04 0.46 0.49 Calculating the updated period from our middle transit time and last published data (1), the value get is P = 1.2174944 d. This value is not compatible with Robert et al. (2012) (P = 1.2175007 d). 140
Twenty years of giant exoplanets - Proceedings of the Haute Provence Observatory Colloquium, 5-9 October 2015 Edited by I. Boisse, O. Demangeon, F. Bouchy & L. Arnold 3 Current Work Atmospheric studies are the next step towards developing a knowledge about hot Jupiter. Kepler-7b and Kepler-12b are two gas giants with identical orbital host star, and physical parameters. These similar features contrast with their di ff erent geometric albedos of 35% and 8%, respectively. Highly reflective clouds have been used to explain the high albedo of Kepler-7b (Demory et al. 2011). We aim to complement the extremely precise photometric Kepler data with spectrophotometric observations of both exoplanets with GTC. If clouds are the key, we expect significant di ff erences in their transmission spectra. 3.1 Data and Observations, New Technique We observed a transit of each one of them with the Osiris instrument on the GTC on two consecutive nights in July 2015. We observed a good data of Kepler-7 and we are planning to reobserve Kepler-12 in the future.The data were taken in spatial scan mode, which slews the telescope during the exposure and moves the spectrum perpendicular to the dispersion direction on the detector. This mode reduces the instrumental overhead time compared to staring mode observations, Kreidberg et al. (2014). Figure 2: An example spatially scanned raw data frame is on the Right Target Kepler-7 4 References Carter, J.N, Winn, J.N., et al. 2009, ApJ, 704, 51C Demory et al. 2011, ApJ, 776L, 25D Eastman et al. 2013, PASP, 125, 83E Gazak et al. 2012, AdAst, 2012, 30G Mandel & Agol 2002, ApJ, 580L,171M Robert J. Siverd et al. 2012, ApJS, 761,123 141
Recommend
More recommend