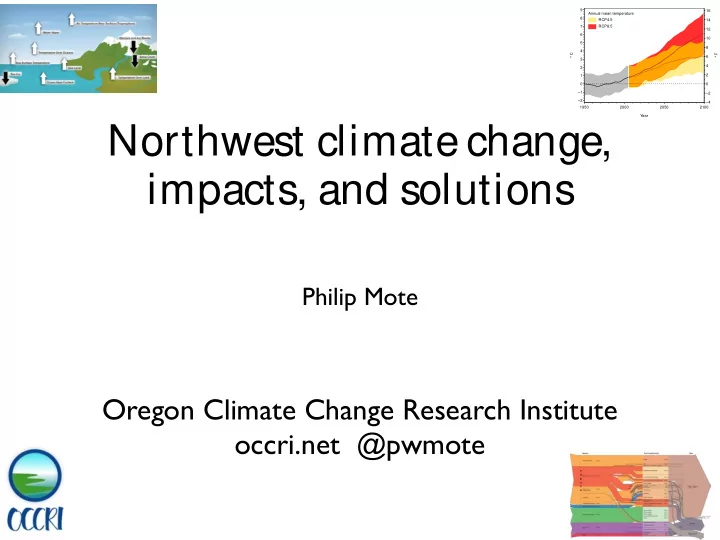

9 16 Annual mean temperature 8 RCP4.5 14 7 RCP8.5 12 6 10 5 8 4 ° C ° F 6 3 4 2 2 1 0 0 − 1 − 2 − 2 − 4 1950 2000 2050 2100 Year Northwest climate change, impacts, and solutions Philip Mote Oregon Climate Change Research Institute occri.net @pwmote
photo credit: Portland Oregonian glacial erratic outside McMinnville, OR, rafted from Lake Missoula floods http://www.oregonlive.com/environment/index.ssf/2012/06/lidar_map_shows_path_of_missou.html
Ice Age Floods Institute
IPCC 2013 Figs 2.1, 2.2, 2.3
source: National Center for Environmental Intelligence ncei.noaa.gov
Ten Indicators of A Warming World US National Climate Assessment, 2014
PNW temperature C limate C hange in the N orthwest Implications for Our Landscapes, Waters, and Communities Difference from 1950-1999 average Edited by: Meghan M. Dalton Philip W. Mote Amy K. Snover 9 16 Annual mean temperature 8 RCP4.5 14 7 RCP8.5 12 6 10 5 8 4 ° C ° F 6 3 4 2 2 1 0 0 − 1 − 2 − 2 − 4 1950 2000 2050 2100 slide ¡by ¡David ¡Rupp, ¡from ¡Mote ¡et ¡al ¡2013 Year
C limate C hange in the N orthwest Three main risks Implications for Our Landscapes, Waters, and Communities Edited by: Meghan M. Dalton Philip W. Mote Amy K. Snover in Northwest climate change • Diminishing snowpack affecting summer water supply • Coastal erosion, inundation • Damage to forests from fires, insects Source: Northwest Climate Assessment Dalton et al. 2013 - see occri.net/reports
Decreasing summer flow in snowmelt watersheds Mote et al., National Climate Assessment 2014, Fig 21.1
from Hoodoo web cam February 23, 2015 This document represents work in progress and is not to be considered final work. Please do not cite or distribute. 10
* *until major subduction earthquake Mote et al., National Climate Assessment 2014, Fig 21.3
Risks to forests Mote et al., National Climate Assessment 2014, Fig 21.7a
Adaptation • Incorporate climate in long-range planning • Evaluate & reduce risks
Increasing)along)RCP8.5,) ~3%)growth)per)year) Raupach et al., Nature Climate Change - Steve Davis, UC Irvine
Oregon’s emissions Total&Greenhouse&Gas&Emissions&&199082012& 80& 72.53& 70& 60& Million&MT&CO2e & 60.94& 2020 goal 56.94& 50& 40& 30& 20& 2050 goal 10& 0& 1990& 1992& 1994& 1996& 1998& 2000& 2002& 2004& 2006& 2008& 2010& 2012& source: Oregon Dept of Energy
Oregon’s emissions Total&Greenhouse&Gas&Emissions&&199082012& 80& 72.53& 70& 60& Million&MT&CO2e & 60.94& 2020 goal 56.94& 50& 40& 30& 20& 2050 goal 10& 0& 1990& 1992& 1994& 1996& 1998& 2000& 2002& 2004& 2006& 2008& 2010& 2012& source: Oregon Dept of Energy, modified by Philip Mote
GHG Flow Diagram: Global Greenhouse Gas Emissions Source: World Resources Institute
Global carbon abatement cost to 2030 Source: McKinsey & Co., 2009
Policy framing • Targeted e.g., BETC, solar tax credits • Systemic e.g., carbon tax/fee, cap & trade
Technological • Transportation • Energy production • Energy efficiency • Agriculture
not part of any Climate Assessment reports
Recommend
More recommend