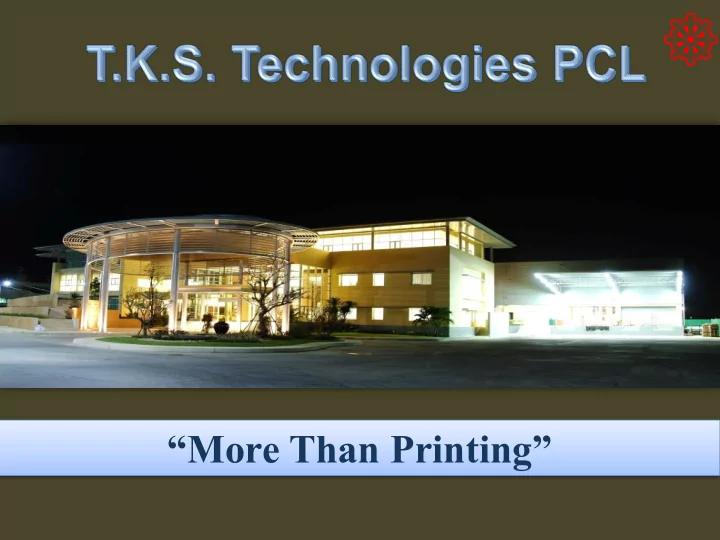

“More Than Printing”
Agenda • T.K.S. Group Structure • Introduction • Business Overview, Vision & Strategy • Our Key Customers • Key Financial Indicator • Sustainability Development
Agenda • T.K.S. Group Structure • Introduction • Business Overview, Vision & Strategy • Our Key Customers • Key Financial Indicator • Sustainability Development
T.K.S Group Structure Mongkolsuthree Holding 35.68% Ms.Suthida T.K.S. Mongkolsuthree 32.12% 19.89% 99.99% 38.51% T.K.S. Siam Press Management 49% By Japan 51.00% 55% By Cambodia 45.00% T.K.S.-Wellco C.T.K.S Technologies
Agenda • T.K.S. Group Structure • Introduction • Business Overview, Vision & Strategy • Our Key Customers • Key Financial Indicator • Sustainability Development
Started Business TKS Introduction 1954 “ T ae K iang S enng ” Renamed to “ T.K.S . Interprinting Co.,Ltd ” 1986 Increased Continuous Paper capacity and relocated to Soi Chamchan Ekamai Established “ Compex (Thailand) ” 1988 as Distributor for computer eripherals The 1 st Printing Plant 1992 at Sampran, Nakornpathom The 1 St Printing Company 1996 to achieve ISO 9002 Certification Registered as a public company and renamed 1997 to “ T.K.S. Enterprises PCL” Move to 2 nd Printing Plant 1998 at Kaoyoi,Petchaburi SYNNEX (Taiwan) 1999 Holding 49% in Compex (Thailand) 2000 ISO 14001 Certification
TKS Introduction Complex(Thailand) renames to Transfer Accessories 2002 SYNNEX (Thailand) PCL To SYNNEX and move office to Sukhonthasawat, Bangkok 2003 T.K.S. Listed in SET Holding 99.99% 2004 Siam Press Management 3 rd Printing Plant 2005 at Sinsakhon Printing City SYNNEX 2008 Listed in SET 2012 Improve IT Department ISO 27001 Certification 2013 ( Information Security Management)
TKS Introduction 60 th Year In Printing Industry 2014 2015 ISO 22301 Certification JV T.K.S - Wellco Carbon Footprint 2016 For Stock Form Product Eco Factory Certification
Agenda • T.K.S. Group Structure • Introduction • Business Overview, Vision & Strategy • Our Key Customers • Key Financial Indicator • Sustainability Development
Business Overview • Advance & Securities Form • Business Form • Digital Printing Existing • Warehouse Management • Office Paper • Linerless Label New • Packaging Business • LAOS • CAMBODIA • MYANMAR
Vision & Strategy
Strategy • Growth & Expansion to CLMV • New Technology Innovation
Strategy : Growth & Expansion • Service Integrated Solutions in LAOS : Full Cloud Billing Solution for EDL • New Joint Venture companies, i.e. Cambodia (C.T.K.S Technologies)
Strategy : New Technology Innovation • Linerless Label & Sticker • Security Packaging
Strategy : New Technology Innovation • Linerless Label & Sticker Separate Label Discount Label Linerless Label Slide Stacker Label Block Stacker Label
Strategy : New Technology Innovation • Security Packaging
Strategy : New Technology Innovation • Key target customers
Agenda • T.K.S. Group Structure • Introduction • Business Overview, Vision & Strategy • Our Key Customers • Key Financial Indicator • Sustainability Development
Our Key Customers
Agenda • T.K.S. Group Structure • Introduction • Business Overview, Vision & Strategy • Our Key Customers • Key Financial Indicator • Sustainability Development
Revenues Stream (MB) Postcard World Cup & Stamp 7-11 +g 6.8% +g 6.8% 1,558 +g 4.6% 1,462 1,201 1,142 CAGR = 4.2% 1,460 1,368 Period: FY2010- FY2016 1,148 -g 12.2% +g 21.6% +g 0.5%
Product Mix For Year 2016 (%) W/H Mgt 16% Adv & Sec. 23% Business Form 14% Digital 13% Office Paper 23% Export 5% Packaging Other 3% 3% Office Paper Business Form W/H Mgt Adv & Sec. Digital Export Packaging Other
Gross Profit (MB) Postcard World Cup & Stamp 7-11 500 30.0% 26.3% 25.4% 25.0% 24.9% 25.0% 21.6% 21.3% 19.9% 20.0% 15.0% 10.0% 5.0% 228 248 256 371 410 341 366 0 0.0% 2010 2011 2012 2013 2014 2015 2016 GP GP%
Net Profit (MB) 500 25.0% 23.0% 21.5% 20.9% 20.0% 17.9% 17.4% 16.1% 15.0% 13.1% 10.0% 5.0% 149 246 215 235 271 285 337 0 0.0% 2010 2011 2012 2013 2014 2015 2016 NP %NP
Financial Ratio: Cash Cycle (Days) 52 49 39 27 26 23 FY2011 FY2012 FY2013 FY2014 FY2015 FY2016 Avg. Cash Conversion Cycle
Financial Ratio: D/E & Financial costs 1.00 3.50% 3.03% 0.90 3.05% 3.00% 0.80 2.15% 2.50% 0.70 0.94 0.60 0.81 2.00% 1.59% 1.52% 0.50 0.72 1.50% 0.40 1.08% 0.56 0.30 1.00% 0.46 0.20 0.34 0.50% 0.10 - 0.00% FY2011 FY2012 FY2013 FY2014 FY2015 FY2016 D/E ratio Financial costs
Financial Ratio: Efficiency ratio 30% 6,000.00 27% 25% 5,000.00 20% 19% 20% 19% 18% 20% 4,000.00 15% 15% 3,000.00 13% 12% 11% 12% 10% 10% 2,000.00 2,317.33 2,308.42 2,063.75 2,294.91 2,518.15 2,294.47 5% 1,000.00 0% - FY2011 FY2012 FY2013 FY2014 FY2015 FY2016 Total Assets (MB) Return on Assets % Return on Equity %
Agenda • T.K.S. Group Structure • Introduction • Business Overview, Vision & Strategy • Our Key Customers • Key Financial Indicator • Sustainability Development
Sustainability Development • Awarded for Eco Factory Project at BITECH BANGNA • Project of Green area at San Phanthai Norasing
Q & A
Recommend
More recommend