Monitoring Rohit Jnagal Anushree Narasimha Outline Overview - PowerPoint PPT Presentation
Container native Monitoring Rohit Jnagal Anushree Narasimha Outline Overview Monitoring for containers Monitoring in a distributed system cAdvisor Application Metrics In cAdvisor Plumbing through a cluster Future
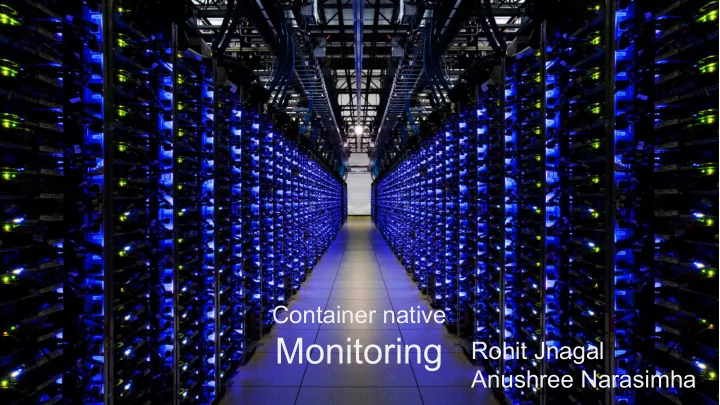
Container native Monitoring Rohit Jnagal Anushree Narasimha
Outline Overview Monitoring for containers ● Monitoring in a distributed system ● cAdvisor ● Application Metrics In cAdvisor ● Plumbing through a cluster ● Future Work Heapster/Kubedash ● Templates ●
Monitoring in three parts Collection collecting data and metrics ● making it discoverable ● plumbing it to higher-level systems ● Processing Ingesting, aggregation ● Analytics ● Managing Actions based on signals ● Alerts. Pagers! ●
Monitoring in three parts Collection collecting data and metrics ● making it discoverable ● plumbing it to higher-level systems ● Processing Ingesting, aggregation ● Analytics ● Managing Actions based on signals ● Alerts. Pagers! ●
Collection in servers/VMs Node agent ● Knows the binary to monitor ● Monitoring logic plugged into agent ● Moving to containers Same node agent - understands multiple ● applications. Applications can push data to agent. ● Sidecars ● Applications publish data. Pulled off by off- ● host agents.
consumers Near-instant data schedulers in cluster management tools ● load balancers ● Alerting systems ● Slower feedback loops Autoscaling / Autoupdaters ● CPI 2 ● Historical Data Offline analysis. ●
Monitoring in distributed environment • Hosts are invisible • Containers can hop around • Monitoring needs to track and correlate multiple containers
In Action!
cAdvisor Analyzes resource usage and performance characteristics of running containers Native Docker support, work with LXC and any other container format Knows containers deeply and monitors their performance github.com/google/cadvisor
Running cAdvisor docker run --volume=/:/rootfs:ro --volume=/var/run:/var/run:rw --volume=/sys:/sys:ro --volume=/var/lib/docker/:/var/lib/docker:ro --publish=8080:8080 --detach=true --name=cadvisor google/cadvisor:latest
API Node and container spec http://host:8080/api/v2.0/machine http://host:8080/api/v2.0/spec/redis?type=docker Hierarchical Container stats: http://host:8080/api/v2.0/stats/nginx?type=docker http://host:8080/api/v2.0/stats?recursive=true Others: /summary, /events, /storage, /attributes, /ps
Storage Backends Coming soon ...
Application Metrics Every container is packaged with its monitoring data. Monitoring moves with the container. Use container composability to stack up metrics from all layers. Use metadata in image or runtime (Docker labels!) to configure monitoring
Configuring containers FROM redis ADD redis_config.json /var/cadvisor/redis_config.json LABEL io.cadvisor.metric.redis="/var/cadvisor/redis_config.json" In cAdvisor read Labels “io.cadvisor.metric.*” read /rootfs/proc/<pid>/root/<config path>
Monitoring Configuration Holds metadata about metrics Endpoint (Location to collect metrics from) ● Name of metric ● Type (Counter, Gauge, ...) ● Data Type (int, float) ● Units (kbps, seconds, count) ● Polling Frequency ● Regexps (Regular expressions to be used to collect a metric) ●
Sample Configurations { "endpoint" : "http://localhost:8000/nginx_status", Get all prometheus metrics: "metrics_config" : [ { { "name" : "activeConnections", "endpoint" : "http://localhost:9100/metrics", "metric_type" : "gauge", } "units" : "number of active connections", "data_type" : "int", "polling_frequency" : 10, "regex" : "Active connections: ([0-9]+)" Get selected prometheus metrics: { }, "endpoint" : "http://localhost:8000/metrics", { "name" : "reading", "metrics_config" : [ "metric_type" : "gauge", { "scheduler_binding_latency", "units" : "number of reading connections", "scheduler_e2e_scheduling_latency", "data_type" : "int", "scheduling_algorithm_latency" "polling_frequency" : 10, } "regex" : "Reading: ([0-9]+) .*" ] } } ] }
App Metrics in action
API Endpoint for custom metrics: http://localhost:8080/api/v2.0/appmetrics/containerName Application metrics being collected can be discovered from the spec: http://localhost:8080/api/v2.0/spec/containerName Regular stats api also reports application metrics: http://localhost:8080/api/v2.0/stats/containerName
Kubernetes Open-source Container orchestration from Google Declarative pattern for managing containers Physical hosts abstracted out as resources Inspired and informed by Borg Kubernetes UI powered by cAdvisor github.com/kubernetes/kubernetes
App Metrics for Kubernetes All kubernetes components run in containers All system services on node runs in containers All kubernetes nodes run cAdvisor (built into kubelet) All kubernetes components expose prometheus metrics App-metrics for kubernetes components!
Heapster Heapster github.com/kubernetes/heapster
Kubedash github.com/kubernetes/kubedash
Templates Add templates for applications that have stable stats API LABEL io.cadvisor.metric.type=redis Infer monitoring information Lookup ports through docker inspection ● hit known endpoints (e.g.: /metrics for prometheus) ● overrides through config ●
Tags Adding tags to specific metrics Convey metric intent to processors eg. Autoscalers
Ongoing work Endpoints Storage drivers Standard config syntax Automagic Plumbing through heapster/kubedash/kubernetes/...
Thank you! Rohit Jnagal jnagal@google Anushree Narasimha anushree.bnp@gmail cAdvisor github.com/google/cadvisor kubernetes kubernetes.io irc #google-containers
Recommend
More recommend
Explore More Topics
Stay informed with curated content and fresh updates.
