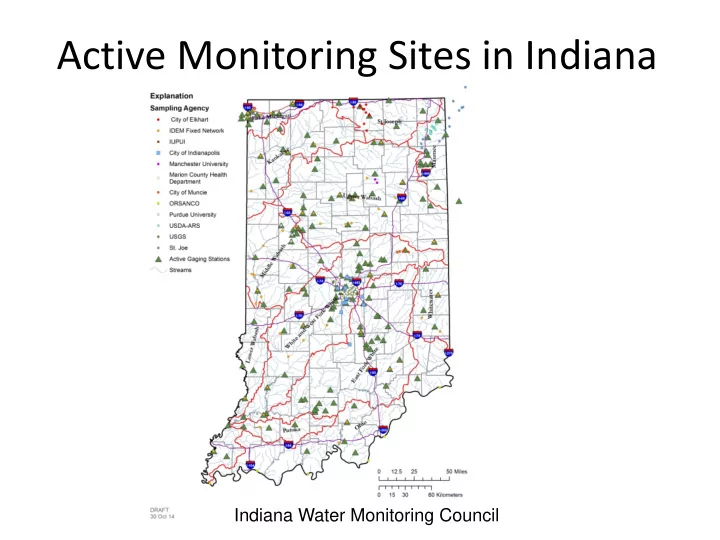

Active Monitoring Sites in Indiana Indiana Water Monitoring Council
Monitoring Water Quality Demonstrating Success Indiana Conservation Partnership Webinar April 16, 2015 Marylou Renshaw, IDEM Office of Water Quality
319 Program Demonstrating Satisfactory Progress IDEM must document five each of the following success stories: • SP-12 : 12-digit HUC watershed shows 40% improvement by removal of impaired streams listed on the 2002 303(d) List of Impaired Waters • WQ-10 : Impairments removed from any 303(d) list with evidence of NPS efforts
Identifying Watersheds: the Process • Data Sources – Integrated Report – Databases – Local watershed group monitoring data – Implementation of conservation practices/best management practices • Honing In – Map 12-digit HUCs – Focus on watersheds with concentration of practices – Confer with monitoring staff • Prepare to Monitor – Do site reconnaissance – Prepare sampling work plan
2015: Monitoring Success in Three Watersheds Fish Creek (St. Joseph, Lake Erie) • Listed in 2002 (IBC and pathogens) • One site for fish and macroinvertebrates • Efforts over the years by TNC, St. Joseph River Watershed Initiative, and Pheasants Forever
2015: Monitoring Success in Three Watersheds Flowers Creek (Eel River, Wabash River) • Listed 2006 (nutrients, dissolved oxygen, IBC) • Two sites for nutrients and two sites for fish and macroinvertebrates • Projects sponsored by Manchester University
2015: Monitoring Success in Three Watersheds Silver Creek (Eel River, Wabash River) • Listed 2006 ( E. coli ) • One site for E. coli • Projects sponsored by Manchester University
2015: Monitoring Success in Three Watersheds Indian Creek (Middle Ohio-Laughery) Listed 2008 ( E. coli ) • and 2014 (IBC) New data indicates E. • coli improvement • One site for fish and macroinvertebrates • Projects sponsored by Historic Hoosier Hills
Nutrients • Total phosphorous, total Kjehldahl nitrogen, nitrate-nitrite, ammonia – nitrogen • Field parameters and general water chemistry • Three sampling events (May-October) • Aquatic Life Use
Bacteriological • Ambient E. coli concentrations and field chemistry • Sampling once each week for five consecutive weeks (April- October) • Human Health Recreational Use and Aquatic Life Use – Exceeding standard if five sample geometric mean >125 colony forming units (cfu) per 100 mL
Fish Community • Sampling once (mid-July-October) • Electrofishing 50-500 meters • Aquatic Life Use: Index of Biotic Integrity (IBI) ≥ 36 = fully supporting – Dependent on watershed location and stream size • # of species • # of sensitive species • % Omnivore individuals • % Simple lithophilic individuals • Total # of individuals • % Individuals with deformities, eroded fins, lesions and tumors
Macroinvertebrate Community • Insects, crayfish and mollusks • Sampling once (mid July-October) • Kick one minute with D-frame net in riffle, sweep bank habitat 50 meters, 15 minute pick for diversity • Aquatic Life Use: Index of Biotic Integrity (mIBI ) ≥ 36 = fully supporting – # of taxa – # of individuals – % intolerant – % predators – % sprawlers
Sampling Results • Reassess data to determine if stream is fully supporting • Document improvement, submit report to the U. S. EPA for approval • Post to website www.idem.IN.gov/nps/3360.htm
Many Thanks • Sponsors of local watershed planning and implementation activities • Local watershed group participants, concerned citizens and landowners installing BMPs and conservation practices • ICP staff
Many Thanks IDEM Staff • Performance measures planning team • Monitoring team • Lab team • QA/QC team • IR coordinator
Recommend
More recommend