MOL2NET, 2017 , 3, doi:10.3390/mol2net-03-xxxx 2 Programming was - PDF document
MOL2NET, 2017 , 3, doi:10.3390/mol2net-03-xxxx 1 MOL2NET, International Conference Series on Multidisciplinary Sciences MDPI http://sciforum.net/conference/mol2net-03 Twitter Data Mining and Predictive Modeling in R Eliana Espinosa (E-mail:
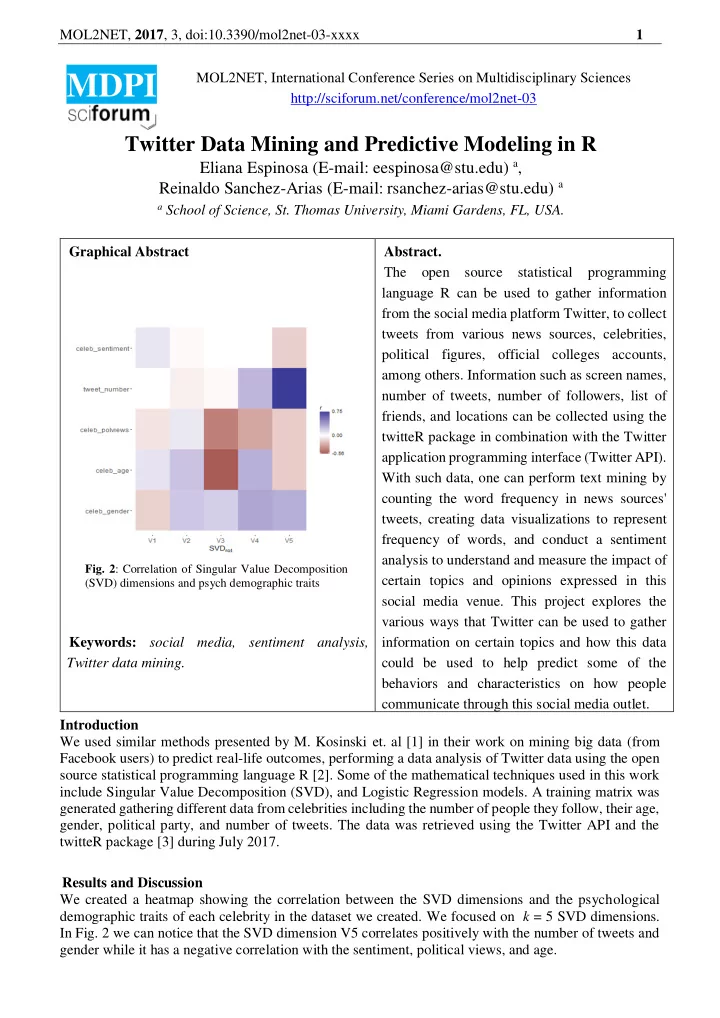
MOL2NET, 2017 , 3, doi:10.3390/mol2net-03-xxxx 1 MOL2NET, International Conference Series on Multidisciplinary Sciences MDPI http://sciforum.net/conference/mol2net-03 Twitter Data Mining and Predictive Modeling in R Eliana Espinosa (E-mail: eespinosa@stu.edu) a , Reinaldo Sanchez-Arias (E-mail: rsanchez-arias@stu.edu) a a School of Science, St. Thomas University, Miami Gardens, FL, USA. Graphical Abstract Abstract. The open source statistical programming language R can be used to gather information from the social media platform Twitter, to collect tweets from various news sources, celebrities, political figures, official colleges accounts, among others. Information such as screen names, number of tweets, number of followers, list of friends, and locations can be collected using the twitteR package in combination with the Twitter application programming interface (Twitter API). With such data, one can perform text mining by counting the word frequency in news sources' tweets, creating data visualizations to represent frequency of words, and conduct a sentiment analysis to understand and measure the impact of Fig. 2 : Correlation of Singular Value Decomposition certain topics and opinions expressed in this (SVD) dimensions and psych demographic traits social media venue. This project explores the various ways that Twitter can be used to gather Keywords: social media, sentiment analysis, information on certain topics and how this data Twitter data mining. could be used to help predict some of the behaviors and characteristics on how people communicate through this social media outlet. Introduction We used similar methods presented by M. Kosinski et. al [1] in their work on mining big data (from Facebook users) to predict real-life outcomes, performing a data analysis of Twitter data using the open source statistical programming language R [2]. Some of the mathematical techniques used in this work include Singular Value Decomposition (SVD), and Logistic Regression models. A training matrix was generated gathering different data from celebrities including the number of people they follow, their age, gender, political party, and number of tweets. The data was retrieved using the Twitter API and the twitteR package [3] during July 2017. Results and Discussion We created a heatmap showing the correlation between the SVD dimensions and the psychological demographic traits of each celebrity in the dataset we created. We focused on k = 5 SVD dimensions. In Fig. 2 we can notice that the SVD dimension V5 correlates positively with the number of tweets and gender while it has a negative correlation with the sentiment, political views, and age.
MOL2NET, 2017 , 3, doi:10.3390/mol2net-03-xxxx 2 Programming was essential in the development of this project. R is an open source language widely used in the data science community, with focus on statistical data analysis, data visualization and machine learning methods. During this project, tools from the tidyverse package [4] were used for data wrangling and data visualization with the help of RStudio, an open source integrated development environment (IDE) for R. Sentiment analysis can be thought of as the exercise of taking a sentence, paragraph, document, or any piece of natural language, and determining whether that text's emotional tone is positive , negative or neutral . Fig. 1 : Sample of celebrities’ data matrix and their Using the Twitter API, we collected information on Twitter accounts (July 2017) the Twitter accounts of celebrities following less than 100 accounts (as of July 2017), and performed sentiment analysis on the messages they posted on this social media outlet. Fig. 3 shows the distribution of sentiment scores from different accounts. Fig. 3 : Sentiment score for tweets by Tom Hanks, Christina Aguilera, Madonna, and Ben Affleck (as of July 2017) Using the twitteR package in R, we gathered information of users who follow the official Twitter account of St Thomas University (https://twitter.com/StThomasUniv). Using the geolocation information associated to each user, longitude and latitude coordinates can be easily mapped, to have a measurement of the diversity of followers of any account. In Fig. 4 we show the locations of the @StThomasUniv followers as an example, both in North America and Worldwide. Fig. 4 : Location of followers of St Thomas University’s official Twitter account Conclusions The conjunction of R for data analysis and different APIs makes for a powerful tool for data mining and visualization of social media outlets data like Twitter. Conflicts of Interest The authors declare no conflict of interest.
MOL2NET, 2017 , 3, doi:10.3390/mol2net-03-xxxx 3 Acknowledgments Authors want to thank St. Thomas University facilities for completing this work during the SRI 2017. This project was supported, in part, by U.S. Department of Education grant award P03C1160161 (STEM SPACE), P031c160143 (STEM EngInE), P120A160036 (STEM ISLE), 1161177 (STEP Up), P120A140012 (SPARC). References 1. Kosinski, M., Wang, Y., Lakkaraju, H., & Leskovec, J. (2016). Mining big data to extract patterns and predict real-life outcomes. Psychological Methods, 21(4), 493-506. 2. R Core Team (2013). R: A language and environment for statistical computing. R Foundation for Statistical Computing, Vienna, Austria. (http://www.R-project.org/) 3. Jeff Gentry (2015). twitteR: R Based Twitter Client. R package version 1.1.9. (https://CRAN.R- project.org/package=twitteR) 4. Hadley Wickham (2017). tidyverse: Easily Install and Load 'Tidyverse' Packages. R package version 1.1.1. (https://CRAN.R-project.org/package=tidyverse)
Recommend


![MOL2NET, 2017 , 3, doi:10.3390/mol2net-03-xxxx 2 [5] allows the processing of EEG signals. Thus](https://c.sambuz.com/678807/mol2net-2017-3-doi-10-3390-mol2net-03-xxxx-2-s.webp)


More recommend
Explore More Topics
Stay informed with curated content and fresh updates.