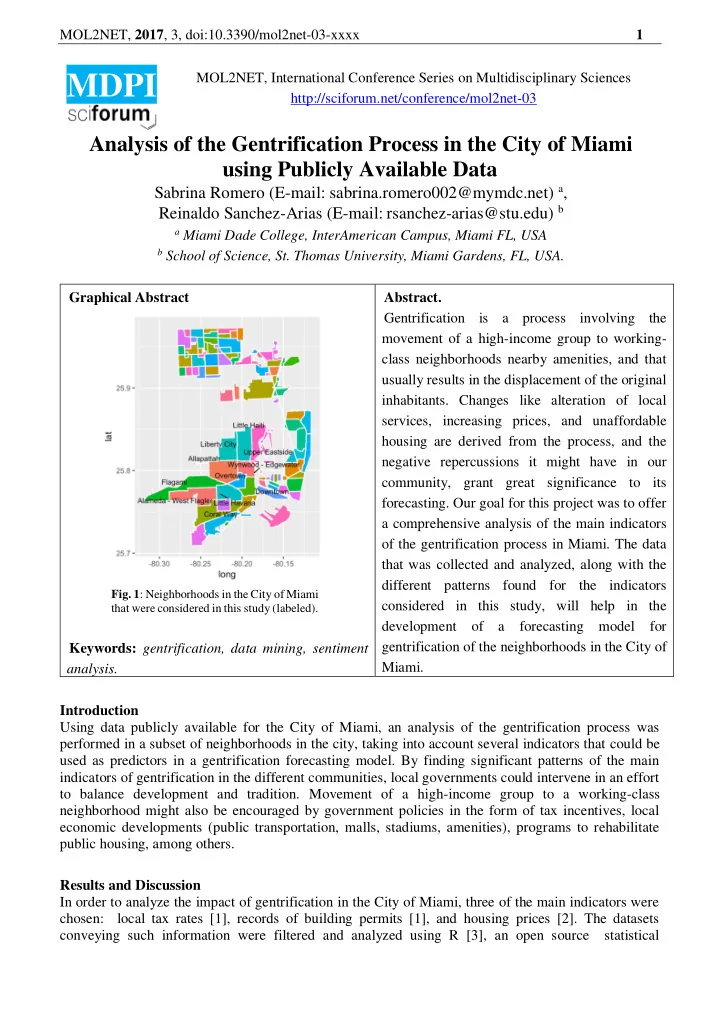

MOL2NET, 2017 , 3, doi:10.3390/mol2net-03-xxxx 1 MOL2NET, International Conference Series on Multidisciplinary Sciences MDPI http://sciforum.net/conference/mol2net-03 Analysis of the Gentrification Process in the City of Miami using Publicly Available Data Sabrina Romero (E-mail: sabrina.romero002@mymdc.net) a , Reinaldo Sanchez-Arias (E-mail: rsanchez-arias@stu.edu) b a Miami Dade College, InterAmerican Campus, Miami FL, USA b School of Science, St. Thomas University, Miami Gardens, FL, USA. Graphical Abstract Abstract. Gentrification is a process involving the movement of a high-income group to working- class neighborhoods nearby amenities, and that usually results in the displacement of the original inhabitants. Changes like alteration of local services, increasing prices, and unaffordable housing are derived from the process, and the negative repercussions it might have in our community, grant great significance to its forecasting. Our goal for this project was to offer a comprehensive analysis of the main indicators of the gentrification process in Miami. The data that was collected and analyzed, along with the different patterns found for the indicators Fig. 1 : Neighborhoods in the City of Miami considered in this study, will help in the that were considered in this study (labeled). development of a forecasting model for gentrification of the neighborhoods in the City of Keywords: gentrification, data mining, sentiment Miami. analysis. Introduction Using data publicly available for the City of Miami, an analysis of the gentrification process was performed in a subset of neighborhoods in the city, taking into account several indicators that could be used as predictors in a gentrification forecasting model. By finding significant patterns of the main indicators of gentrification in the different communities, local governments could intervene in an effort to balance development and tradition. Movement of a high-income group to a working-class neighborhood might also be encouraged by government policies in the form of tax incentives, local economic developments (public transportation, malls, stadiums, amenities), programs to rehabilitate public housing, among others. Results and Discussion In order to analyze the impact of gentrification in the City of Miami, three of the main indicators were chosen: local tax rates [1], records of building permits [1], and housing prices [2]. The datasets conveying such information were filtered and analyzed using R [3], an open source statistical
MOL2NET, 2017 , 3, doi:10.3390/mol2net-03-xxxx 2 programming language widely used in the data science community. Furthermore, the public opinion of each of the neighborhoods was obtained from social media, specifically, from Twitter. For this endeavor, sentiment analysis was implemented. Data analysis was performed using R, an open source language widely used in the data science community, with focus on statistical data analysis, data visualization and machine lear ning methods. Tools from the “tidyverse” package [4] were used for data wrangling and data visualization with the help of RStudio, an open source integrated development environment (IDE) for R. For example, using data published by Zillow [2], an online real estate database company that has data on 110 million home across the United States, we compared the median home value in Fig. 2, that shows the different trends from 2011 to 2016. Sentiment analysis can be thought of as the exercise of taking a sentence, paragraph, document, or any piece of natural language, and determining whether that text's emotional tone is positive , negative or neutral . Using the Twitter API, we collected a set of tweets during the month of July, in which any mention to the neighborhoods being analyzed in this study was made. The data was transformed, arranged, and analyzed in R, and a sentiment analysis was performed to compare the different public opinions via social media. In Fig. 3 we show a snippet of the code used for performing sentiment analysis, and Fig. 4 shows the sentiment score for the different neighborhoods. Similar approaches could be used to extend a gentrification model and social media will continue to be used as a strong indicator of the public opinion in future studies. Fig. 2 : Median Housing Prices in Miami’s neighborhood s Fig. 3 : Sample R script to compute the “sentiment” Fig. 4 : Sentiment Analysis. Public opinion of each neighborhood of each tweet mentioning the neighborhoods that from Twitter during July 2017. were part of this study. Conclusions Using open access datasets and data mining techniques, results from our analysis confirm the high development standards of the Downtown, Wynwood, Coconut Grove, and Brickell neighborhoods. Further research including data on crime rates, demographics, tax incentives tools, public transportation and other indicators, will help to build a forecasting model of gentrification. Conflicts of Interest The authors declare no conflict of interest. Acknowledgments Authors want to thank St. Thomas University facilities for completing this work during the SRI 2017. This project was supported, in part, by U.S. Department of Education grant award P03C1160161 (STEM
MOL2NET, 2017 , 3, doi:10.3390/mol2net-03-xxxx 3 SPACE), P031c160143 (STEM EngInE), P120A160036 (STEM ISLE), 1161177 (STEP Up), P120A140012 (SPARC). References 1. Miami-Dade County GIS Open Data. (http://gis-mdc.opendata.arcgis.com/datasets/) 2. Zillow Data. URL (https://www.zillow.com/research/data/#median-home-value) 3. R Core Team (2013). R: A language and environment for statistical computing. R Foundation for Statistical Computing, Vienna, Austria. (http://www.R-project.org/) 4. Hadley Wickham (2017). tidyverse: Easily Install and Load 'Tidyverse' Packages. R package version 1.1.1. (https://CRAN.R-project.org/package=tidyverse)
Recommend
More recommend