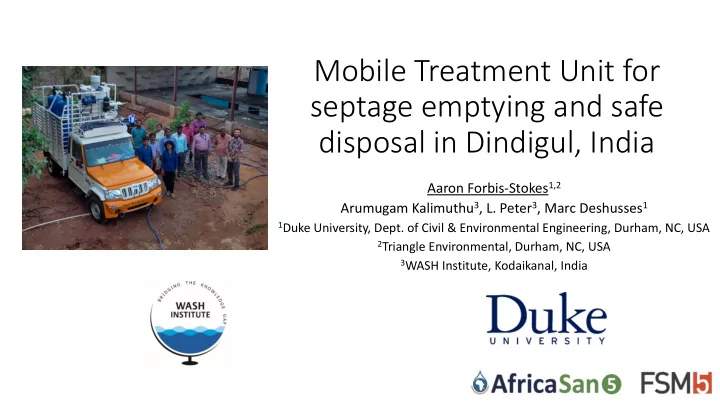

Mobile Treatment Unit for septage emptying and safe disposal in Dindigul, India Aaron Forbis-Stokes 1,2 Arumugam Kalimuthu 3 , L. Peter 3 , Marc Deshusses 1 1 Duke University, Dept. of Civil & Environmental Engineering, Durham, NC, USA 2 Triangle Environmental, Durham, NC, USA 3 WASH Institute, Kodaikanal, India
Background Urban septage treatment 38% of urban households in India solutions are needed at 62% of households in cities <1 million decentralized level 2
Background Treat and discharge septage onsite. Save time, fuel, and money. 3
Mobile Treatment Unit – Technology overview Holding Tank Partial UF return (58 µm mesh) Discharge Septic Tank Dual-Media GAC MF (x2) UF (Pebbles & Sand) (#4x8 mesh) (10 & 5 µm) (0.02 µm) Centrifuge Solids collection (Compost/Disposal MTU uses off-the-shelf separation technologies to produce a clean effluent quickly and cost-effectively 4
Methods • Phase I – 1 unit • No backwash • Operational: Pressure, flow & power every 15 minutes • Treatment: First pass & final pass sample each location • Phase II – 4 units (3 new) • Reverse flow backwash every 30 minutes • Operational: Pressure, flow & power every 15 minutes Target flow: 3,000 L/hr • Treatment: Final pass septage & UF Pressures: membrane life and fouling effluent Effluent quality: Meet Indian discharge standards 5
Operational performance – Phase I 2.000 Initial flow-rates decreased and 1.800 did not fully recover. 1.600 1.400 Flow rate (L/h) 1.200 1.000 800 600 400 200 0 0 20 40 60 80 100 120 140 160 Time (h) 6
Operational performance – Phase I Volume treated (L) 0 20.000 40.000 60.000 80.000 100.000 3,00 3,00 Rapid increase of Transmembrane Pressure for MF 2,50 2,50 2,00 2,00 TMP (bar) 1,50 1,50 1,00 1,00 0,50 0,50 0,00 0,00 0 20 40 60 80 100 120 140 160 Time (h) MF UF 7
Treatment performance – Phase I COD (mg / L) Total Coliform (CFU / 100 mL) 1,000,000 100,000 10,000 1,000 100 10 1 Effluent meets Indian discharge limits 8
Phase I Conclusions Phase I Challenge Phase II Improvement Maintain high target flow rates Routine backwashing during run Rapid MF fouling Increase MF surface area Occasional high solids tanks Additional low-cost pre-screening Standard India CPCB WASHi Effluent ✔ pH 6.5-9.0 7.7 ✔ COD (mg/L) [old, not in new] 100 66 ✔ BOD (mg/L) 30 24 ✘ TSS (mg/L) 100 103 ✔ Total Coliform (CFU/100 mL) 1,000 83 9
Operational performance – Phase II Flow rates maintained, 4.500 4.500 MTU-1 MTU-2 TMP decreased 4.000 4.000 3.500 3.500 Flow rate (L/h) Flow rate (L/h) 3.000 3.000 2.500 2.500 2.000 2.000 1.500 1.500 1.000 1.000 500 500 0 0 0 50 100 150 0 10 20 30 40 Time (h) Time (h) 4.500 4.500 4.000 MTU-3 4.000 MTU-4 3.500 3.500 Flow rate (L/h) Flow rate (L/h) 3.000 3.000 2.500 2.500 2.000 2.000 1.500 1.500 1.000 1.000 500 500 0 0 0 5 10 15 20 25 30 35 0 5 10 15 20 25 Time (h) Time (h) 10
Treatment performance – Phase II 11
Expenses OpEx CapEx ($ / 3,000 L Septic tank) $35.000 $18 Hardware $46 typical fee for $30.000 $16 Monitoring 3,000 L septic tank $14 Filtration $25.000 Vehicle $12 Cleaning $20.000 $2.620 $10 Power Diesel $15.000 $132 $8 Filtration $6 Vehicle $10.000 $3.617 $4 $5.000 $2 $9.317 $0 $0 Traditional septic MTU MTU 12
Case Study: MTU in Kerala • 4 MTUs sent to Kerala in response to severe flooding, August 2018 • First 9 days: • 330,000 L septage treated • 34,965 beneficiaries Aug. 25 th – Dec. 14 th 2018: • • 156 septic tanks emptied • 918,222 L treated • ~200,000 beneficiaries • Effluent samples met all discharge standards 13
Next steps Patent: Filed and awaiting finalization Commercialization In discussion with partners Interested customers: relief agencies, small-scale entrepreneurs Automation: Improve operation efficiency, decrease operator requirements 14
Thank you! Arumugam Kalimuthu Marc Deshusses Aaron Forbis-Stokes akalimuthu@washinstitute.org marc.deshusses@duke.edu aaron@triangle-environmental.com Program Director Professor Sanitation Technology Consultant WASH Institute Duke University Triangle Environmental www.washinstitute.org www.sanitation.pratt.duke.edu www.triangle-environmental.com 15
Additional slides 16
Operational performance – Phase II MTU-2 MTU-4 Volume treated (L) Volume treated (L) 0 10.000 20.000 30.000 0 20.000 40.000 60.000 3,50 3,50 3,00 3,00 2,50 2,50 TMP (bar) TMP (bar) 2,00 2,00 1,50 1,50 1,00 1,00 0,50 0,50 0,00 0,00 0 10 20 30 0 5 10 15 20 Time (h) Time (h) MF UF MF UF Low TMP, MF no longer fouling likely undersized pump 17
Recommend
More recommend