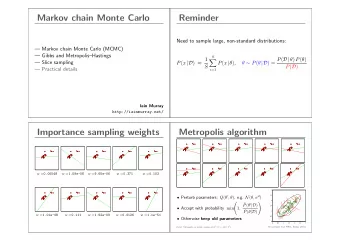
Markov chain Monte Carlo population synthesis of single radio pulsars in the Galaxy Marek Cieślar 1 , Tomasz Bulik 1 , Stefan Osłowski 2,3,4 1. Astronomical Observatory, Univeristy of Warsaw Al. Ujazdowskie 4 00-478 Warsaw, Poland 2. Centre for Astrophysics and Supercomputing Swinburne University of Technology Hawthorn,Victoria 3122, Australia 3. Fakultat fur Physik, Universitat Bielefeld Postfach 100131, 33501 Bielefeld, Germany 4. Max-Planck-Intitut fur Radioastronomie Auf dem Hugel 69, 53121 Bonn, Germany
Motivation for the project ● Replication of the Faucher-Giguere, Kaspi 2006 with enhancements. ● Markov chain Monte Carlo probing of the parameter space (initial conditions, magnetic field decay, radio-luminosity law). ● A general purpose population generator. An arbitrary large set of pulsars with statistical properties similar to observed sample.
Model Components Overview Dynamics Physics Observations ● Galactic potential ● P,Pdot,B evolution ● Minimal observable ● Kicks (lighthouse model) flux (survey-wise) ● Initial position in ● B Decay ● DM (YMW16) ● Beaming fraction the Arms (exponential) ● Death lines/area ● Survey coverage ● Luminosity model
Initial position and kicks The position in arms adopted after ● Faucher-Giguere&Kaspi Hobbs2005 kicks 1D Maxwellian ● distribution with RMS 265 km/s Integration with the Position Verlet ● method (leap-frog family)
B Field Decay P-Pdot-B ● B decay formula ● Dipole model ● P(t)
Luminosity models ● Narayan (as a reference) ● Rotational model (proportional to ~Lrot) ● Power-law model ● 400Mhz→1400Mhz
Death Area Death lines after Rudak and Ritter, 1994 Psi = 0.2
Parkes Multibeam Survey The ATNF cut ● Parkes Multibeam Survey ● Parkes window (GalL, GalB) ● Not MSP (B >= 1e10 G) ● All fields present (P,Pdot,S1400,GalL,GalB,B,DM) → 970 PSRs
Dispersion measure – YMW16 model Difference with NE2001 – considerable more computational time ● Less numerical artefacts ●
Dispersion measure – YMW16 model Difference with NE2001 – considerable more computational time ● Less numerical artefacts ●
Markov chain Monte Carlo computation Dynamics Physics Observations ● Galactic potential ● P,Pdot,B evolution ● Minimal observable ● Kicks (lighthouse model) flux (survey-wise) ● Initial position in ● B Decay ● DM (YMW16) ● Beaming fraction the Arms (exponential) ● Death lines/area ● Survey coverage ● Luminosity model the main bottleneck
Density of a PSRs ● Density at a given point is a given by a Gaussian average: ● From a regular grid of points in the P-Pdot-S comparison space, a set of 700 location in the vicinity of observed PSRs is chosen. ● Normalization to 1.
Likelihood of a model ● The Probability of making a measurement of a particular density of modeled PSRs equal ‘m’, given that the density of the observed PSR is equal ‘o’, is described by a normal distribution: ● Then the likelihood statistic is computed ● Which allows to compare two models with different set of parameters
Power-law
Power-law model
Rotational
Rotational model
Power-law Rotational
Power-law
Rotational
SKA predictions
Estimated number of detected PSRs Rotational Rotational SKA-1-Mid-B ~1200 SKA-1-Mid ~2300 Power-law
The Indri code The code can be obtained from the github site: https://github.com/cieslar/indri
Summary ● The MCMC can be used for pulsar population synthesis (never done before) ● The preferred magnetic decay scale is ~4Myr ● The correlation in luminosity parameters and magnetic decay scale implicate degenerate model or over-parametrization ● Estimated increase of PSRs for the SKA is between 23 − 137% compared to Parkes Multibeam Survey
Recommend
More recommend
Unleash a World of Digital Possibilities—Browse, Share, and Explore Content Without Boundaries