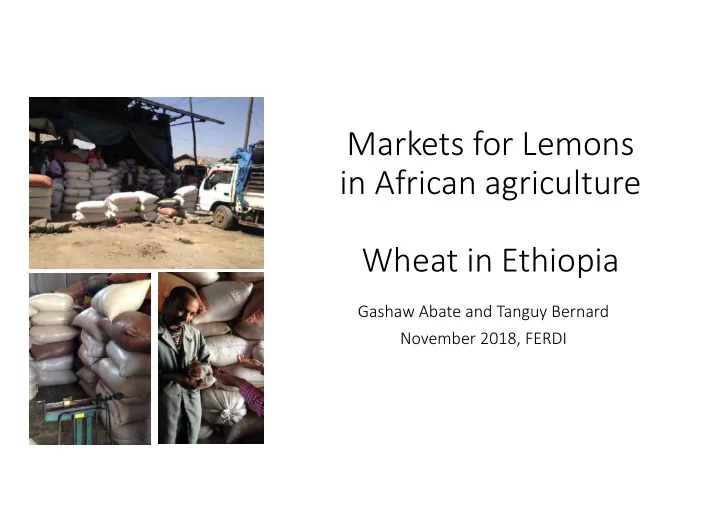

Markets for Lemons in African agriculture Wheat in Ethiopia Gashaw Abate and Tanguy Bernard November 2018, FERDI
Increased demand for ‐‐ quality ‐‐ staples % hh having consumed food item at least once in past 7 days Source: LSMS‐ISA survey data for Nigeria Source: Brookings, based on UN DESA (2014)
Reliance on home production ? Net exports, selected commodities, 1961‐2011 Wheat price ($/ton) Source: FAO
Issues of G&S for small‐scale staple producers • Export crops: • Clearly defined G&S • Explicit quality premiums • Compliance with G&S mandatory • Smallholder aware and capable • Staple crops: when they exist, G&S based on international trade levels • Unattainable • Expensive to assess (given size of transaction) • Compliance with G&S voluntary • Unknown Source: 18 country diagnostic by IFPRI
The case of wheat producers in Ethiopia Fact #1 – Small producers = small transactions Production Transactions 18 20 16 18 16 14 14 12 12 Percent Percent 10 10 8 8 6 6 4 4 2 2 0 0 0 5 10 15 20 25 30 35 40 45 50 55 60 65 70 75 80 85 90 95 0 <=1 1-2 2-3 3-4 4-5 5-6 6-7 7-8 8-9 9-10 >10 Quantity of wheat produced (quintals) Monthly transactions per household (quintals) Source : IFPRI Wheat survey, 2015
Fact #2 – Smallholders sell to aggregators with incomplete accounting of quality Aggregated farmers production being sold to… Quality attributes checked before sales Unobservable (e.g. flour yields) Processors/wholesalers (incl. EGTE)/seed enterprise Foreign matter Varietal mix Consumers Softness / hardness Cooperatives Uniformity color Traders Uniformity size 0% 10% 20% 30% 40% 50% 60% 70% 80% 90% 100% 0% 10% 20% 30% 40% 50% 60% 70% 80% Source : IFPRI Wheat survey, 2015
Fact #3 – Unobservable does not pay at bottom of value chain. Aggregation lowers average quality Price per quintal paid by miller to traders Price per quintal paid by traders to farmers 95 95 (approximated by test‐weight) 90 90 Flour extraction rate 85 85 80 80 75 75 70 70 65 65 400 500 600 700 800 900 1000 1100 1200 1300 1400 920 930 940 950 960 970 980 990 1000 1010 1020 bandwidth = .8 Source : IFPRI Wheat survey, 2015 Source : Miller’s administrative data in Addis Ababa, 2015
Fact #4 – given unobservable quality, trust is important Test : trained 540 farmers to assess Do you trust traders’ scales? validity of traders’ scales using their 45 body‐weight 40 35 30 Percent 25 20 15 66% Found traders’ scale to under‐ 10 estimate their body weight 5 0 h l 0 h t l a a c c h u u t w m a m e t y o y m r r n o e e , v s v o 3kg , t N , s s o by on average e n e Y Y , o N
Fact #5 – Low investments to enhance unobservable quality Bale and Aris: good soil quality East Gojam and North Shewa: poor soil quality, N ↑(unobservable) quality N ↑ yields 80 70 70 60 60 50 50 Percent 40 Percent 40 30 30 20 20 10 10 0 0 0 5 10 15 20 25 30 35 40 45 50 55 60 65 70 75 80 85 90 95 0 5 10 15 20 25 30 35 40 45 50 55 60 65 70 75 80 85 90 95 Quantity of urea applied per ha (kg) truncated at 100kg Quantity of urea applied per ha (kg) truncated at 100kg
Reducing information asymetries One way to fix market issues: reduce information asymetries • Interesting case: farmers miss information about the quality of their own product • Quality partly depends on some factors potentially unknown to farmers (e.g. soil quality) • What happens when farmers learn about the quality of their own product? • Diffuse simple test‐weight measures through video‐mediated extension in Ethiopia • Collect sample fo wheat from each farmer to independently assess quality
Share of wheat sold (marketed surplus) 45.00 15% farmers in treatment group did check the 40.00 Percentage share (unobservable) quality of their grain 35.00 Farmers sell more and obtain better prices upon finding that their wheat is of higher quality (flour 30.00 extraction rate). share sold low high remote less-remote grain quality remoteness Price received for wheat grain Control Quality trg 8.00 Farmers tend to sell less through cooperatives when 7.75 the revealed quality of their wheat is higher Price per Kg (aggregation issue) 7.50 7.25 Higher investments in quality enhancing inputs in following years 7.00 price received low high remote less-remote grain quality remoteness Control Quality trg
Would you be willing to pay « X birr » per quintal for an independent quality and weight certification service? (% yes ) 100% Strong reaction to a rather light‐touch 90% intervention. 80% Producers react strongly to quality 70% 60% signals and adapt their relationship to 50% markets 40% Increased willingness to pay for 30% independent quality certification 20% 10% 0% 10 20 30 40 50 60 70 80 90 100 Baseline Endline Source : IFPRI Wheat survey, 2015
Current organisation of the Wheat value chain in Ethiopia ? = = coop trader miller
Can it be fixed? = = = coop trader miller = Independent certification Unbiased Willingness to Pass through Level of price quality pay for of price premium? assessment? service? premium?
Conclusion • Inclusive value chains : where small farmers can participate without needing protection from costly trade policies • Supply‐side intervention (inputs, extension etc.) will not work unless clear incentive from output markets. • “Small” necessary aggregation potential incentive dilution • “Fixing” output markets for small scale farmers requires more piloting and learning.
Recommend
More recommend