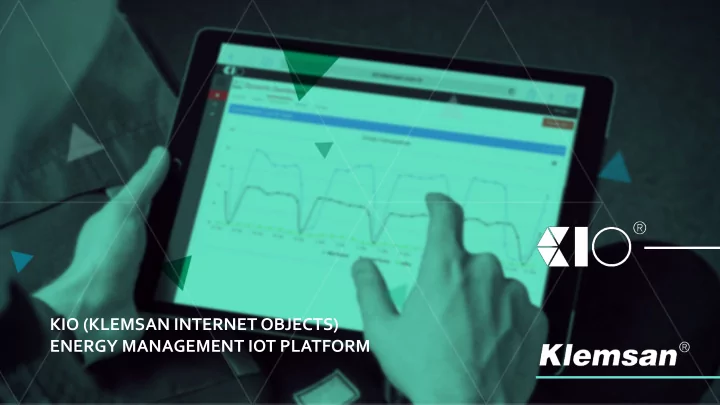
KIO (KLEMSAN INTERNET OBJECTS) ENERGY MANAGEMENT IOT PLATFORM Table - PowerPoint PPT Presentation
KIO (KLEMSAN INTERNET OBJECTS) ENERGY MANAGEMENT IOT PLATFORM Table of Contents Industry 4.0 Current Status & Future Prospect Of IoT Moving from Talk to Action Klemsan IoT Platform: KIO Roadmap of KIO KIO Case studies in KLEMSAN KIO
KIO (KLEMSAN INTERNET OBJECTS) ENERGY MANAGEMENT IOT PLATFORM
Table of Contents Industry 4.0 Current Status & Future Prospect Of IoT Moving from Talk to Action Klemsan IoT Platform: KIO Roadmap of KIO KIO Case studies in KLEMSAN KIO Case studies with our customers: - Burger King China - Medicana (Hospital) - Zafer Plaza (Shopping Mall) - Bilfen (School) - New business models by cooperating with different partners
Why Industry 4.0? Leaders It leads into the Innovation Economy. GII (Global Innovation Index) scores and GDP per Achievers GII score capita in PPP$ (bubbles sized by population) Note: ‘Efficient innovators’ are countries/economies with Innovation Efficiency ratios ≥ 0.66; ‘Inefficient innovators’ have ratios < 0.66; the trend line is a Underperformers relative to GDP polynomial of degree three with intercept ( R 2 = 0.661). Efficient innovators Inefficient innovators GDP per capita in PPP$ (logarithmic scale)
Why Industry 4.0? Manufacturing cost index , 2014 (U.S.=100) Ultimate solution of high-cost countries which were losing ground: - Increase productivity China United South Italy Belgium Canada Mexico India Australia Brazil Indonesia Sweden Czech - Add value by States Korea Republic Germany Japan France Nether- United Russia Taiwan Switzer- Spain Thailand Poland Austria innovation lands Kingdom land Volume of exports (highest to lowest)) Labor* Electricity Natural Gas Other Sources: U.S. Economic Census ; U.S.Bureau of Labor Statistics ; U.S. Bureau of Economic Analysis; International LabourOrganization ; Euromonitor International; Economist Intelligence Unit; BCG analysis. Note: The index covers four direct costs only. No difference is assumed for other costs, such as raw-material inputs and machine and tool depreciation. Cost structure is calculated as a weighted average across all industries. (*)- Adjusted for productivity.
Industry 4.0 INDUSTRY INDUSTRY INDUSTRY INDUSTRY 1.0 2.0 3.0 4.0 18th century Mid 20th century Today 19th century Advanced robotics 3D printing ICT’s Steam power Electricity Internet of Things Electronics Artificial Intelligence Big data Mechanical Intelligent, flexible production, moving Mass production and Automated and and distributed away from cottage assembly line networked production production industry
Industry 4.0 Industrial sectors are planning to commit US$907 bn p.a. Within two years to Industry 4.0 – around 5% of revenue p.a. Two to five years Digital technologies like sensors or connectivity devices ₋ More than five years Software and applications like manufacturing execution ₋ systems Training programs for the employees in order to improve ₋ Digital IQ and form Digital Culture in the organization Expected ROI on Industry 4.0 investment 55% of the investments expect a payback within two years.
Industry 4.0 Cost reduction Cost reduction (in % p.a. until 2020) (in US$bn p.a. until 2020) Aerospace, defence & Safety Automotive Chemicals Electronics Engineering & construction Forest, paper & packaging Industrial manufacturing Metals Transportation & logistics Companies in every industry Weighted Average Total sector expect significant cost reductions Q: What cumulative benefits from digitisation do you expect in the next 5 years? Lower costs.
Industry 4.0 Example Scenarios: 1- Shop floor to Top floor - Intra company vertical integration Supplier Quality Mfg Collaboration Operator 2-Machine to Machine (M2M) IoT Apps and - Autonomous equipments Analytics E-Commerce 3-Customer Integration Service Provider Customer - Direct integration of e-shops - Usage pattern improvement 4- Manufacturing Collaboration ERP - Track and Trace - Genealogy / Recipe - Direct replenishment MES Vertical vs Horizontal - Asset Intelligence Network Integration 5-Analytics SCADA - Predictive maintenance Manufacturing - Predictive quality / Reduced scrap Company - OEE Equipment - Energy Mgmt Layer
Industry 4.0 Mobile devices Cloud computing IoT platforms Augmented Location reality/wearables detection Industry 4.0 framework technologies and contributing digital Industry 4.0 Multilevel customer technologies Advanced interaction and human-machine customer profiling interfaces Big data analytics and advanced algorithms Authentication & fraud detection Smart sensors 3D printing
Current Status & Future Prospect Of IoT ‘‘THINGS’’ vs ‘‘PEOPLE’’ 6.3 Billion 6. 8 Billion 7.2 Billion 7.6 Billion World Population Connected Devices 500 Million 12.5 Billion 25 Billion 50 Billion More connected Connected Devices devices than Per Person people
2017 KIO: Klemsan Internet Objects 2016 StoP Series Plug-In Terminals IoT Platform 2014 SysteMon Energy Monitoring Software 2012 DNV Certificate, Exporting to 75 Countries 2011 Second Factory for Wiring Duct Production, E-Klemsan Portal 2009 Manufacturing of PYK Series Practical Spring Clamp Terminals 2008 ICEX Certificate, EU -REACH Compliant Production, Patent for PYK Terminals 2007 SMD Assembly Lines and Electronics Production 2006 Fully Automatic Assembly Lines 2005 Moved to Izmir – Kemalpasa Facilities, RoHS ans GOST-R Certificates 2004 UK Series Cross -Connectors, First International Patent: German Patent Institute 2003 ATEX and CSA Certificates, Manufacturing of YBK Series Spring Clamp Terminals Cooperation with 2001 Weidmuller Manufacturing of AVK Series Screw Type Terminals 1980 - 1994 2000 First Participation for Hannover Messe, Started Exporting to 17 Countries 1998 Acquisition by FEKA Group, ISO 9001 Certificate, First VDE Certificate for PEK Series 1991 Manufacturing of First Polyamid Based Terminals: PEK Series 1986 Izmir – Pinarbasi Facilities Established 1974 Established in Istanbul, Production of MEK Series Terminals
Why KIO? Energy saving is still cheaper Range of Levelized Costs (cents per kWh) than obtaining energy. Energy efficiency investments have still the lowest cost among all other energy investments. Return on investment in energy efficiency is too short. Energy Wind Natural Gas Utility-Scale Coal Community Coal Nudear Efficiency* Combined Solar PV Solar PV IGCC Cycle *Notes: Energy efficiency program portfolio data from Molina 2014; All other data from Lazard 2017. High-end range of coal includes 90% carbon capture and compression.
Why KIO? Energy costs have dramatically increased over the last 15 years
KIO – Energy Management IOT Platform Energy Management Dashboard HVAC Lighting Electricity Human Count Control Sensors Meter Temp. Gas Door Lighting Control Sensors Meter Sensors Refrigeration Pressure Water LED Sensor Meter Lighting Gateways
Features of KIO
Roadmap of KIO KIO V1.0 KIO V1.2 KIO V1.4 - Mimic Diagram - Graphical Based Monitoring Screen - KIO Mobile Application -Time Period Management - Manual Data Entry (with Excel) - Measurement and Counter Sensor Addition - Conditional Alarm Management -Weather Information Addition - Energy Efficiency Applications -Automatic Licensing - CO2 Emission and TEP Calculation - Energy Measurement Plan Report - Measurement & Verification Reports (ENPG) - Energy Parsing Analyzer (EPA) January 2017 March 2017 June 2017 January2018 December 2018 Future KIO V1.3 KIO V1.1 KIO V1.5 - Invoice Management - Consumption Comparison - Prediction Management - Human Count - Alarm Monitoring Screen - Big Data Analysis - Hourly Data Management -Dynamic Dashboard -Advanced Database - Scheduled Reports
Digital Conversion in Energy ENERGY 4.0
CASE STUDIES in Klemsan
Case Studies in KLEMSAN ENERGY EFFICIENCY PROJECTS: PREVENTIVE MAINTENANCE PROJECTS: 1. Compressor 1. Lighting 2. Air flow pipe 2. Heat Insulation of Injection Machine 3. Monitoring Consumption of Assembly Line COMPENSATION CONTROL SAFETY PROJECT: Protection against overvoltage or lightning ONGOING PROJECTS
Energy Efficiency Project - Lighting BEFORE AFTER Fluorescent Lighting LED Lighting Lighting SystemTransformation
Energy Efficiency Project - Lighting 1400 Benefits: 1200 - Reduction in electricity bill 1000 - Improvement in ambient conditions 800 kWh 600 Energy Saving: 400 68% 200 Return on Investment (ROI): 0 24 Months Jan Mar May Jul Sep Nov Jan Electronic Manufacturing Department Lighting
EnergyEfficiencyProject - HeatInsulationof InjectionMachine BEFORE AFTER Without Jacket With Jacket
EnergyEfficiencyProject - HeatInsulationof InjectionMachine 250 Benefits: 200 - Energy Saving - Increase in Machine Efficiency 150 Energy Saving: 100 8% 50 Return on Investment (ROI): 8,7 Months 0 30. Jan 1. Feb 3. Feb 5. Feb 7. Feb 9. Feb 11. Feb 13. Feb Holiday Holiday Injection Machine MEN 13 – Index Active T1 ImportTotal Predicted annual saving: 290.000kWh
Energy Efficiency Project - Monitoring Consumption of Assembly Line BEFORE AFTER Lighting Ventilation Air Main Consumption Conditioner Breakdowns of of Automatic Automatic Assembly Assembly Lighting – Air Conditioner -Ventilation
Energy Efficiency Project - Monitoring Consumption of Assembly Line Benefits: - Deeper analysis of energy consumption by monitoring breakdowns - Comparative energy consumption analysis - Avoiding unnecessary usage of electricity
Recommend


More recommend
Explore More Topics
Stay informed with curated content and fresh updates.