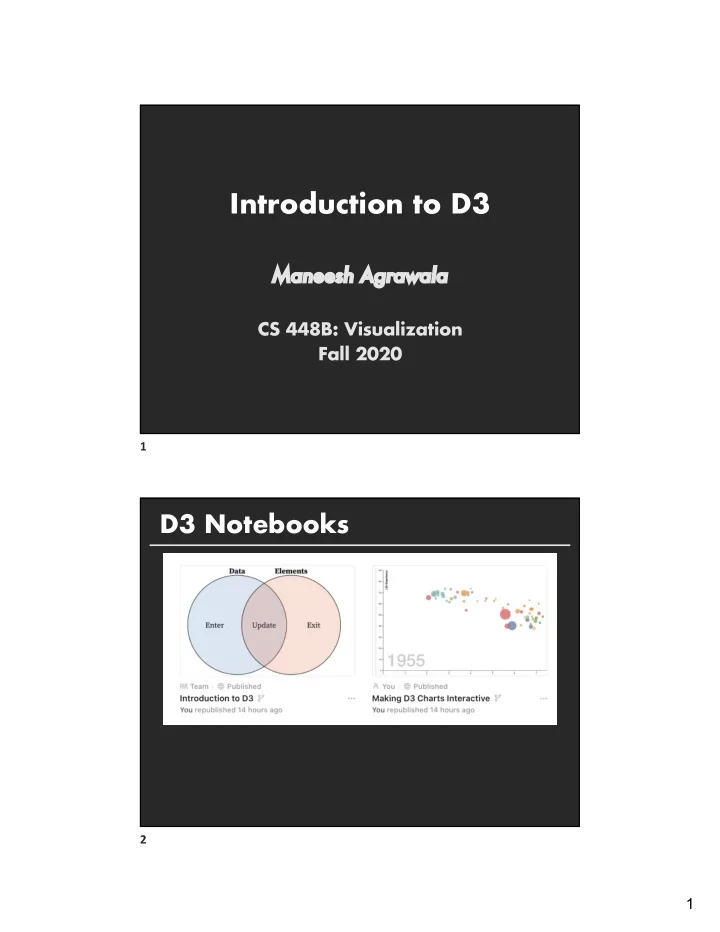

Introduction to D3 Ma Maneesh Agrawala CS 448B: Visualization Fall 2020 1 D3 Notebooks 2 1
Last Time: Interaction 3 Dynamic Queries 6 2
Query and results SELECT house FROM east bay WHERE price < 1,000,000 AND bedrooms > 2 ORDER BY price 7 HomeFinder [Ahlberg and Schneiderman 92] 9 3
Zipdecode [from Fry 04] https://benfry.com/zipdecode/ 17 NameVoyager http://www.babynamewizard.com/voyager 18 4
DimpVis [Kondo 14] 19 Parallel Coordinates [Inselberg] 20 5
TimeSearcher [Hochheiser & Schneiderman 02] Based on Wattenberg ’ s [2001] idea for sketch-based queries of time-series data. 21 3D dynamic queries [Akers et al. 04] 22 6
3D dynamic queries [Akers et al. 04] 23 Pros and cons Pros I Controls useful for both novices and experts I Quick way to explore data Cons I Simple queries I Lots of controls I Amount of data shown limited by screen space 24 7
Summary Most visualizations are interactive I Note that even passive media elicit interactions Good visualizations are task dependent I Pick the right interaction technique Fundamental interaction techniques I Selection, Brushing & Linking, Dynamic Queries 25 Announcements 26 8
A2: Exploratory Data Analysis Use Tableau to formulate & answer questions First steps Step 1: Pick domain & data Step 2: Pose questions Step 3: Profile data Iterate as needed Create visualizations Interact with data Refine questions Author a report Screenshots of most insightful views (10+) Include titles and captions for each view Due before class on Oct 6, 2020 27 Assignment 3: Dynamic Queries Create a small interactive dynamic query application similar to TimeSearcher, but for top 100 personalities on Cable TV News. Implement timeboxes 1. interface Submit the application 2. and a short write-up on canvas Can work alone or in pairs Due before class on Oct 20, 2020 28 9
29 Introduction to D3 30 10
What is D3? D3: “Data-Driven Documents” Data visualization built on top of HTML, CSS, JavaScript, and SVG Pros: Highly-customizable Developing and debugging tools Documentation, resources, community Integrates with the web! Cons: Very “low-level” 31 hello-world.html <!DOCTYPE html> <html> <head> <meta charset="utf-8"> </head> <body> Hello, world! </body> </html> 32 11
hello-world.html <!DOCTYPE html> <html> <head> <meta charset="utf-8"> </head> <body> Hello, world! </body> </html> 33 hello-svg.html <!DOCTYPE html> <html> <head> <meta charset="utf-8"> <style> /* CSS */ </style> </head> <body> <svg width="960" height="500"> <circle cx='120' cy='150' r='60' style='fill: gold;'> <animate attributeName='r' from='2' to='80' begin='0' dur='3' repeatCount='indefinite' /> </circle> </svg> </body> </html> 36 12
hello-svg.html <!DOCTYPE html> <html> <head> <meta charset="utf-8"> <style> /* CSS */ </style> </head> <body> <svg width="960" height="500"> <circle cx='120' cy='150' r='60' style='fill: gold;'> <animate attributeName='r' from='2' to='80' begin='0' dur='3' repeatCount='indefinite' /> </circle> </svg> </body> </html> 37 hello-javascript.html <!DOCTYPE html> <html> <head> <meta charset="utf-8"> <style> /* CSS */ </style> </head> <body> Hello, world! <script> console.log(“Hello, world!”); function add2(x) { return x + 2; } console.log("2 + 2 is " + add2(2)); </script> </body> </html> 38 13
hello-javascript.html <!DOCTYPE html> <html> <head> <meta charset="utf-8"> <style> /* CSS */ </style> </head> <body> Hello, world! <script> ... console.log(“Hello, world!”); function add2(x) { return x + 2; } console.log("2 + 2 is " + add2(2)); </script> </body> </html> 39 hello-d3.html <!DOCTYPE html> <html> <head> <meta charset="utf-8"> <style> /* CSS */ </style> </head> <body> <script src="https://d3js.org/d3.v6.min.js"></script> <script> // JavaScript code that handles the logic of adding SVG elements // that make up the visual building blocks of your data visualization </script> </body> </html> 40 14
DOM: Document Object Model <html> <head> <title></title> </head> <body> <h1></h1> <div> <p></p> </div> </body> </html> [Adapted from Victoria Kirst’s cs193x slides. ] 41 DOM: Document Object Model <html> <head> html <title></title> </head> head body <body> <h1></h1> <div> title h1 div <p></p> </div> p </body> </html> [Adapted from Victoria Kirst’s cs193x slides. ] 42 15
DOM: Document Object Model <html> <head> html <title></title> </head> head body <body> <h1></h1> <div> title h1 div <svg></svg> </div> svg </body> </html> [Adapted from Victoria Kirst’s cs193x slides. ] 43 D3: Selection <html> … <svg width="960" height="500"> <circle cx="10" cy="10" r="5"></circle> <circle cx="20" cy="15" r="5"></circle> </svg> 44 16
D3: Selection <html> <script> … <svg width="960" height="500"> // select all SVG circle <circle cx="10" cy="10" r="5"></circle> elements <circle cx="20" cy="15" r="5"></circle> </svg> var circles = d3.selectAll("circle"); </script> 45 D3: Selection & Manipulation <html> <script> … <svg width="960" height="500"> // select all SVG circle <circle cx="10" cy="10" r="5"></circle> elements <circle cx="20" cy="15" r="5"></circle> </svg> var circles = d3.selectAll("circle"); // set attributes and styles circles.attr("cx", 40); circles.attr("cy", 50); circles.attr("r", 24); circles.style("fill", "red"); </script> 46 17
D3: Selection & Manipulation <html> <script> … <svg width="960" height="500"> // select all SVG circle <circle cx="10" cy="10" r="5"></circle> elements <circle cx="20" cy="15" r="5"></circle> </svg> var circles = d3.selectAll("circle"); // set attributes and styles circles.attr("cx", 40); circles.attr("cy", 50); circles.attr("r", 24); circles.style("fill", "red"); </script> 47 D3: Selection & Manipulation <html> <script> … <svg width="960" height="500"> // select all SVG circle <circle cx="10" cy="10" r="5"></circle> elements <circle cx="20" cy="15" r="5"></circle> </svg> var circles = d3.select("circle"); // set attributes and styles circles.attr("cx", 40); circles.attr("cy", 50); circles.attr("r", 24); circles.style("fill", "red"); </script> 49 18
D3: Selection & Manipulation <html> <script> … <svg width="960" height="500"> // all together!! <circle cx="10" cy="10" r="5"></circle> d3.select("circle") <circle cx="20" cy="15" r="5"></circle> .attr("cx", 40) </svg> .attr("cy", 50) .attr("r", 24) .style("fill", "red"); </script> 50 Binding Data & Joining DOM Elements 51 19
Binding Data & Joining DOM Elements A join creates three sub-selections: Enter : selection containing placeholders for every data value that did • not have a corresponding DOM element in the original selection Update : selection containing existing DOM elements that match a • bound data value Exit : selection that also contains existing DOM elements, but for which • a matching data value was not found 53 Binding Data & Joining DOM Elements 54 20
Let’s make a scatterplot 😹 🐷 https://observablehq.com/@stanfordvis/lets-make-a-scatterplot 55 21
Recommend
More recommend