Interconnection Networks Programmierung Paralleler und Verteilter - PowerPoint PPT Presentation
Interconnection Networks Programmierung Paralleler und Verteilter Systeme (PPV) Sommer 2015 Frank Feinbube, M.Sc., Felix Eberhardt, M.Sc., Prof. Dr. Andreas Polze Interconnection Networks 2 SIMD systems demand structured connectivity
Interconnection Networks Programmierung Paralleler und Verteilter Systeme (PPV) Sommer 2015 Frank Feinbube, M.Sc., Felix Eberhardt, M.Sc., Prof. Dr. Andreas Polze
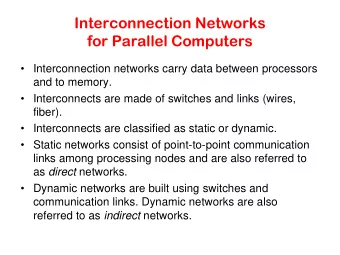
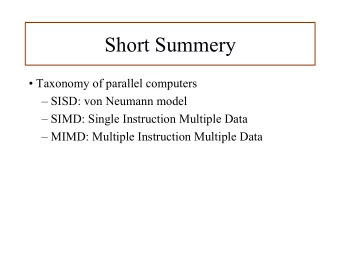
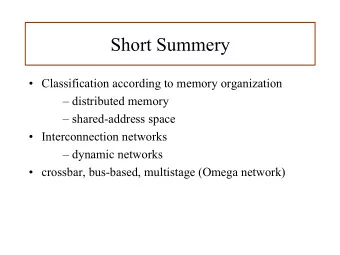
Interconnection Networks 2 ■ SIMD systems demand structured connectivity □ Processor-to-processor interaction □ Processor-to-memory interaction ■ Static network □ Point-to-point links, fixed route ■ Dynamic network □ Consists of links and switching elements □ Flexible configuration of processor interaction
Interconnection networks Optimization criteria Connectivity – ideally direct links between any two stations High number of parallel connections Cost model Production cost - # connections operational cost – distance among PEs Bus networks, switching networks, point-to-point interconnects 3
Interconnection Networks 4
Interconnection Networks 5 ■ Dynamic networks are built from a graph of configurable switching elements ■ General packet switching network counts as irregular static network [Peter Newman]
Interconnection Networks ■ Network Interfaces □ Processors talk to the network via a network interface connector (NIC) hardware □ Network interfaces attached to the interconnect ◊ Cluster vs. tightly-coupled multi-computer □ SIMD hardware bundles NIC with the processor ■ Switching elements map a fixed number of inputs to outputs □ Total number of ports is the degree of the switch □ The cost of a switch grows as square of the degree □ The peripheral hardware grows linearly as the degree
Interconnection Networks ■ A variety of network topologies proposed and implemented ■ Each topology has a performance / cost tradeoff ■ Commercial machines often implement hybrids □ Optimize packaging and costs ■ Metrics for an interconnection network graph □ Diameter : Maximum distance between any two nodes □ Connectivity : Minimum number of edges that must be removed to get two independent graphs □ Link width / weight : Transfer capacity of an edge □ Bisection width : Minimum transfer capacity given between any two halves of the graph □ Costs : Number of edges in the network ■ Often optimization for connectivity metric
Bus Systems 8 ■ Static interconnect technology ■ Shared communication path, broadcasting of information □ Diameter: O(1) □ Connectivity: O(1) □ Bisection width: O(1) □ Costs: O(p) …
Bus network Optimal #connection per PE: 1 Constant distance among any two PEs 9
Crossbar switch � (Kreuzschienenverteiler) Arbitrary number of permutations Collision-free data exchange High cost, quadratic growth n * (n-1) connection points 10
Crossbar Switch 11
Multistage Interconnection Networks 12 ■ Connection by switching elements ■ Typical solution to connect processing and memory elements ■ Can implement sorting or shuffling in the network routing
Omega Network 13 ■ Inputs are crossed or not, depending on routing logic □ Destination-tag routing: Use positional bit for switch decision □ XOR-tag routing: Use positional bit of XOR result for decision ■ For N PE’s, N/2 switches per stage, log 2 N stages ■ Decrease bottleneck probability on parallel communication
Delta networks Only n/2 log n delta- switches Limited cost Not all possible permutations operational in parallel 14
Delta Networks operation 15 ■ Stage n checks bit k of 0 the destination tag 1 ■ Possible effect of ‚output port contention‘ 2 and ‚path contention‘ 3 4 5 6 7
Clos coupling networks Combination of delta network and crossbar C.Clos, A Study of Nonblocking Switching Networks, Bell System Technical Journal, vol. 32, no. 2, 1953, pp. 406-424(19) 16
Fat-Tree networks PEs arranged as leafs on a binary tree Capacity of tree (links) doubles on each layer 17
Point-to-point networks: � ring and fully connected graph Ring has only two connections per PE (almost optimal) Fully connected graph – optimal connectivity (but high cost) 18
Mesh and Torus Compromise between cost and connectivity 19
Cubic Mesh PEs are arranged in a cubic fashion Each PE has 6 links to neighbors 20
Hypercube Dimensions 0-4, recursive definition 21
Binary tree, quadtree Logarithmic cost Problem of bottleneck at root node 22
Shuffle-Exchange network Logarithmic cost Uni-directional shu ffl e network + bi-directional exchange network 23
Plus-Minus-Network PM 2i – 2*m-1 separate unidirectional interconnection networks 24
Systolic Arrays 25 ■ Data flow architecture ■ Common clock ■ Maximum signal path restricted by frequency ■ Single faulty Problem: common clock – element breaks the complete array faulty processing element
Comparison Bisection Arc Cost Network Diameter Width Connectivity (No. of links) Completely-connected Star Complete binary tree Linear array 2-D mesh, no wraparound 2-D wraparound mesh Hypercube Wraparound k -ary d -cube
Comparison Arc Cost Network Diameter Bisection Width Connectivity (No. of links) Crossbar Omega Network Dynamic Tree
Comparison of networks 28
Recommend


More recommend
Explore More Topics
Stay informed with curated content and fresh updates.