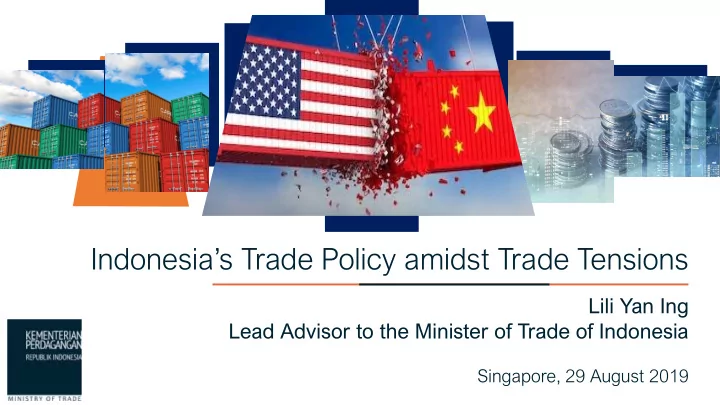

Indonesia’s Trade Policy amidst Trade Tensions Lili Yan Ing Lead Advisor to the Minister of Trade of Indonesia Singapore, 29 August 2019 1
The World Economy 2019 19 The World Economy grows at 3,2% International trade is back to the 1930s 30s with average tariff rates of 32% Ministry of Trade of the Republic of Indonesia – www.kemendag.go.id 2
E7 will be double size of G7 by 2050 G7: Canada, France, Germany, Italy, Japan, United Kingdom, United States GDP E7: China, India, Brazil, Indonesia, Mexico, Russia, Turkey (USD bn, 2016 constant) 160,000 G7 E7 140,000 120,000 100,000 80,000 60,000 40,000 20,000 - 2016 MERs 2050 MERs 2016 PPPs 2050 PPPs Note: MERs is Market Exchange Rates Source: The World in 2050 – Summary Report, PWC retrieved on 22 August 2019 Ministry of Trade of the Republic of Indonesia – www.kemendag.go.id 3
Asia: 5 out the top 7 gainers in the share of manufacturing value added to the world Canada China France (%) India Indonesia Poland (%) Germany Italy Japan Korea, Rep. Thailand Singapore United Kingdom 35 3.5 30 3.0 25 2.5 20 2.0 1.5 15 1.0 10 0.5 5 - - 1970 1973 1976 1979 1982 1985 1988 1991 1994 1997 2000 2003 2006 2009 2012 2015 2018 1970 1973 1976 1979 1982 1985 1988 1991 1994 1997 2000 2003 2006 2009 2012 2015 2018 Source: Ministry of Trade Staff, reconstruction from Baldwin (2011) Ministry of Trade of the Republic of Indonesia – www.kemendag.go.id 4
Indonesian and ASEAN Economies ASEAN Economy Indonesian Economy GDP: USD 2,9 trillion GDP : USD 1 trillion 2016 —2018, ASEAN’s 2016 —2018, Indonesia’s exports to the world grew exports to the world grew 14% 12% In 2018, the population In 2018, the population 648 million people 263 million people Ministry of Trade of the Republic of Indonesia – www.kemendag.go.id 5
Intra — ASEAN Trade Intra ASEAN Trade Intra ASEAN trade (USD Bn) to trade with the world (%) 25 25 400 25 344.6 350 24 24 300 281.5 263.4 23 250 23 200 163.7 22 22 150 85.4 100 21 50 0 20 2001 2005 2010 2015 2018 Intra Trade Share of Intra ASEAN Trade to the World Source: UNComtrade, retrieved on 22 August 2019 Ministry of Trade of the Republic of Indonesia – www.kemendag.go.id 6
Indonesia’s Exports and Imports, 2015 — 2018 Export Growth Exports, Imports Composition of Imports in 2018 (%) (USD billion) 200 20 Consumer Goods 9% 188.7 180 180 168.8 15 156.9 160 150.3 145.1 142.6 10 135.6 140 5 120 100 0 80 -5 60 -10 40 -15 20 0 -20 Intermediate Capital Goods 2015 2016 2017 2018 Goods 16% Exports Imports Export's Growth 75% Source: Indonesia Statistics, August 2019 Ministry of Trade of the Republic Indonesia – www.kemendag.go.id 7
Indonesia’s Trade Agreements Concluded, 2018 — 2019 In-effect On-going 1. Indonesia — Australia CEPA 2. Indonesia — EFTA CEPA 3. Indonesia — Chile CEPA 1. Regional Comprehensive 1. Indonesia – Japan EPA 4. MOU Indonesia — Palestine Economic Partnership (RCEP) 2. Indonesia – Pakistan FTA 5. Indonesia — Mozambique PTA 2. Indonesia — EU CEPA 3. ASEAN — China FTA 6. ASEAN — HK FTA & Investment 3. Indonesia — Korea CEPA 4. AANZFTA 7. ASEAN — Japan Inv, Service & MNP 4. Indonesia — Turkey CEPA 5. ASEAN — India FTA 5. Indonesia — Iran PTA 4 th ASEAN Comprehensive Investment 6. ASEAN TIGA • 6. Indonesia — Bangladesh PTA 7. ASEAN — Japan CEP Agreement (ACIA) 7. Indonesia — Tunisia PTA 10 th ASEAN Trade in Services (ATISA) 8. ASEAN — Korea FTA • 8. Indonesia — Morocco PTA 10 th ASEAN Framework on Services • on E-Commerce Notes: Ministry of Trade Data, as of 8 August 2019 Ministry of Trade of the Republic of Indonesia – www.kemendag.go.id 8
Recommend
More recommend