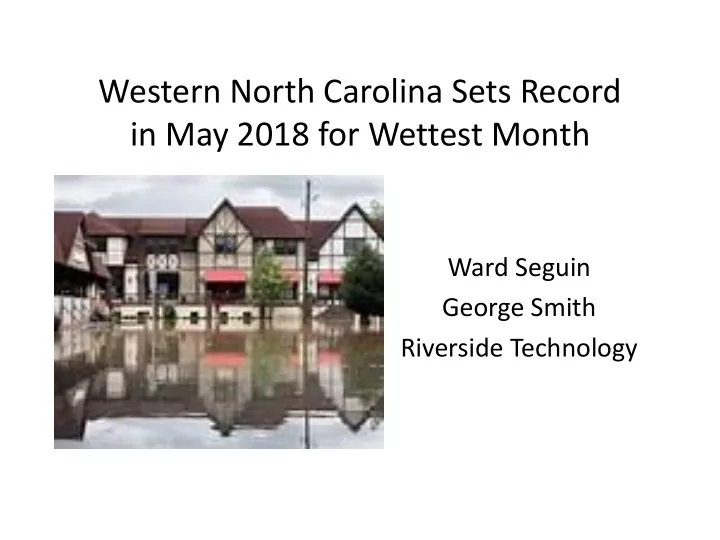

Western North Carolina Sets Record in May 2018 for Wettest Month Ward Seguin George Smith Riverside Technology
Meteorological Situation – May 2018 • Large broad-scale/long-wave ridge dominated CONUS • Two low pressure systems brought above normal precipitation to the southeast. • May 15-19 • May 28-30, TS Alberto (Source: https://www.ncdc.noaa.gov/sotc/synoptic/201805)
Asheville, North Carolina
May 18, 12Z Surface Analysis (Source: https://www.ncdc.noaa.gov/sotc/synoptic/201805)
May 18, 12Z 500-mb Heights Source: https://www.ncdc.noaa.gov/sotc/synoptic/201805
May 29, 12Z Surface Analysis (showing Tropical Storm Alberto) Source: https://www.ncdc.noaa.gov/sotc/synoptic/201805
Subtropical Storm Alberto (Source: National Hurricane Center Tropical Storm Alberto Report, Oct. 18, 2018)
Average May 2018 Precipitation by County (CoCoRaHS Stations with 31 days of observations. Number of stations with 31 days shown in parenthesis.) 8.7 (3) 7.0 (4) 10.1 (14) 15 (1) 8.3 (9) 10.4 (1) 11.9 (2) 12 (4) 18.9 (10) 12.3 (1) 18.4 (3)
Individually, these are not record setting daily events for AVL. Duration Record Rainfalls Maximum Rainfall Maximum (Short wave Rainfall low pressure Alberto system) One Day 6.40 - Oct. 18,1879 2.92 – May 18 1.77 – May 29 Two Day 7.94 - Oct 24-25, 1918 3.99 – May 17-18 2.93 – May 29-30 Three Day 8.49 - Oct 24-26, 1918 6.78 - May 16-18 3.96 – May 28-30 Four Day 8.51 - Oct 24-27, 1918 Five Day 8.54 – Oct 24-28, 1918 8.21 - May 15-19 Source: https://www.weather.gov/gsp/avlcli http://scacis.rcc-acis.org/
French Broad River Response Hydrograph at Blantyre May 8-22, 2018 (Note: Blantyre is 30 miles south of Asheville.)
French Broad River Response Hydrograph at Blantyre May 21 – June 4, 2018
Inundation along the French Broad River from Tropical Storm Alberto as Depicted by Riverside’s “ RiverTrak ” Model Blantyre Bridge and River Gauge
June 1 st Flooding Looking west Looking east toward bridge Blantyre Bridge Saturated soils from the first storm enabled TS Alberto to cause significant flooding and mud slides. Parking lot by Bridge
Summary of Impacts • More than 50 roads across 13 counties were closed at some point due to flooding and mudslides • Five people perished • Extensive agricultural losses • Thousands without power • Two thousand residences evacuated below the Tahoma dam* because of a mud slide and a potential dam failure • Businesses and residents flooded in Asheville * - The Tahoma dam is approximately 40 miles northeast of Asheville.
Land Slides County Land Slides Storm Date Over 80 * Polk May 18th Rutherford 1 May 19, 2018 7 May 28-30, 2018 (Alberto) McDowell 7 May 18-30, 2018 4 May 30, 2018 (Alberto) Henderson 1 May 19, 2018 1 + June 6, 2018 1 # Watauga May 30, 2018 (Alberto) * -This number includes at least 18 major debris flows and one fatality + - Landslide over NC route #9 # - Landslide damaged propane gas supply to house causing an explosion, 2 fatalities
Tryon, NC Mudslide 50 Miles South of Asheville 5-6 Inches of Rain in Three Hours on May 18, 2018 Source: Times-News August 1, 2018
Tryon Fatality Debris Flows Source UAV Image Broad River Fire Dept.
U.S. 176 Closed Source: Times-News May 20, 2018
Source: Times-News June 12, 2018
Natural Disaster Declared U.S. Agriculture Secretary Sonny Perdue declared for four North Carolina counties: Buncombe, Henderson, Madison and Transylvania natural disasters. Crop losses • Strawberries -60% • Squash, cucumbers – 50% • Sod – 40-60% Fertilizer leeched out
Summary Meteorological situation • Two slow-moving weather systems including tropical storm Alberto contributed to a record amount of rainfall in May. Impact • Five people perished • More than 50 roads across 13 counties were closed at some point • One County experienced over 80 landslides • U.S. Dept. of Agriculture declared four North Carolina counties as natural disaster areas Observing, forecasting and communicating the event • NWS forecast and guidance was good • WFO Greenville provide e-mails to emergency managers during the first event and held morning briefings for Tropical Storm Alberto
Wettest Months https://www.weather.gov/media/gsp/Climate/AVL/newAVLwetdrymonths.pdf Month Rainfall in Year Inches January 9.95 1989 February 9.60 1873 March 9.86 1975 April 8.70 1989 May 14.68 2018 June 10.73 1989 July 13.69 2013 Note the number August 13.75 1940 of record months in the last 30 September 13.71 2004 years. October 11.32 1918 November 7.82 2015 December 9.16 2009
Questions?
Recommend
More recommend