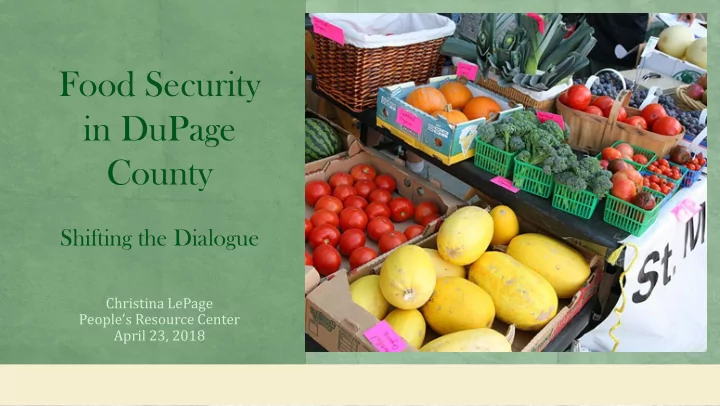

Food Security in DuPage County Shifting the Dialogue Christina LePage People’s Resource Center April 23, 2018
DEFINING PARAMETERS WORKGROUP GOAL RECOMMEND PARAMETERS OF A GOOD FOOD SYSTEM
DUPAGE ASSETS DUPAGE HEALTH COALITION IMPACT DUPAGE FORWARD DUPAGE COMMUNITY HUNGER NETWORK
PROXIMITY TO RESOURCES AND NEED DUPAGE COUNTY FY16 vs FY17 FY 16 FY 17 Source: Northern Illinois Food Bank, 2017
CHALLENGES Childhood Obesity & Chronic Disease Prevalence Threats to the Safety Net Balancing Client-Choice & Nutrition Education
DUPAGE DATA
Childhood Obesity DuPage County (2016 – 2017) 14.8 percent of kindergarten, sixth grade, and ninth grade public school students in DuPage County had obesity 44 percent of students with obesity had an elevated blood pressure (BP) reading The obesity rate among children aged 2 to 4 years enrolled in DuPage County's Women, Infants, and Children (WIC) Program (15.1 percent in 2016) continues to exceed the national WIC rate (14.5 percent in 2014), stressing the need for early intervention Source: DuPage County Health Department, December 2017
CHILDHOOD OBESITY RATES BY REGION DUPAGE COUNTY 2015/2016 vs 2016/2017 15’/16’ 16’/17’ Source: DuPage County Health Department, 2016 & 2017
DUPAGE DATA 7.3% of residents experience food insecurity at some point during the year 13% of children under 18 years of age live in households that experienced food insecurity 45% of children who are food insecure come from households with incomes above 185% of the federal poverty level who are likely not income-eligible for federal assistance SOURCE: DUPAGE HUNGER STUDY 2014
THREATS TO OUR SAFETY NET
CLIENT CHOICE
SHIFTING THE DIALOUGE
RESILENT HEALTH- TRANSPARENT PROMOTING WHAT IS A GOOD FOOD SYSTEM? FAIR SUSTAINABLE DIVERSE
Metropolitan Chicago's GO TO 2040 recommends the region support sustainable local food through: • Greater sustainable local food production and processing. • Increased equitable access to fresh, nutritious, and affordable foods. • Greater awareness through data, research, training, and information to support local food systems. Source: CMAP- LOCAL FOOD, RETRIEVED ON 4/15/18
CHICAGO METROPOLITAN PLANNING ASSOCIATION
GOOD FOOD SYSTEM Accessible: All families and individuals have equitable access to healthy, affordable, and safe food Sustainable: Enhances the community’s environmental, economic, and social well-being Health-promoting: Improves healthy eating habits and lowers the risk of diet related diseases such as diabetes and obesity
SOCIAL DETERMINANTS OF HEALTH FOOD SECURITY ENVIRONMENTAL HEALTH LOCAL FOOD SYSTEM
CONSUMPTION INDICATOR DUPAGE SOURCE Adults eating fewer than 5 83% BRFS, 2013 fruits/vegetables each day Nutrition Education Sites - % of 36% Feeding America, 2014 NIFB Member Agencies Children and Adolescents who 14.80% DCHD, 2016-2017 are Obese DuPage WIC obesity rates for 2-4 15.10% DCHD, 2016 year olds
DISTRIBUTION INDICATOR DUPAGE ILLINOIS U.S. SOURCE People with low access to a 22.6% 19.36% 22.43% USDA, 2015 grocery store People 65+ with low access to 2.60% USDA, 2015 a grocery store Low income and low access to 18.93% 14.68% 18.94% USDA, 2015 food SNAP authorized retailers - 5.1 7.19 8.25 USDA, 2017 rate per 10,000 pop. WIC authorized retailers - rate 15.7 18.40 15.60 USDA, 2011 per 100,000 pop. Emergency Food Pantries 50 * * NIFB, 2017 (NIFB Members Agencies) 100+ * * NIFB, 2017 Northern Illinois Food Bank - Direct Connect Retail Partners Northern Illinois Food Bank - 14,430,000 lbs * * NIFB, 2017 lbs of food distributed 3 * * NIFB, 2018 School-based Food pantries
PRODUCTION & PROCESSING INDICATOR Farmer's Market Density - rate per 1,000 pop. Community Gardens/CSA's/food co-ops Inventory of community agricultural land zoning Use of locally grown food products in school food service programs Northern Illinois Food Bank - Direct Connect Retail Partners
FAST FOOD DENSITY DUPAGE COUNTY 2009-2014 Source: USDA Food Atlas, 2009 - 2014
DuPage Farmer’s Markets: Active & Non-Active Source: DuPage County, GIS – last updated May, 2016
NIFB RESOURCES - Direct Connect Weekly Pick Ups - Fresh Rescue - Milk2MyPlate Source, NIFB 2017
Public Food Rx Benefit FORWARD Programs Programs Good Nutrition Impact DuPage Food Education System DuPage Gardenworks Community Schools Community Hunger Gardens Network Local Agricultural Healthcare SCARCE Groups Partners
GROUP DISCUSSION
Recommend
More recommend