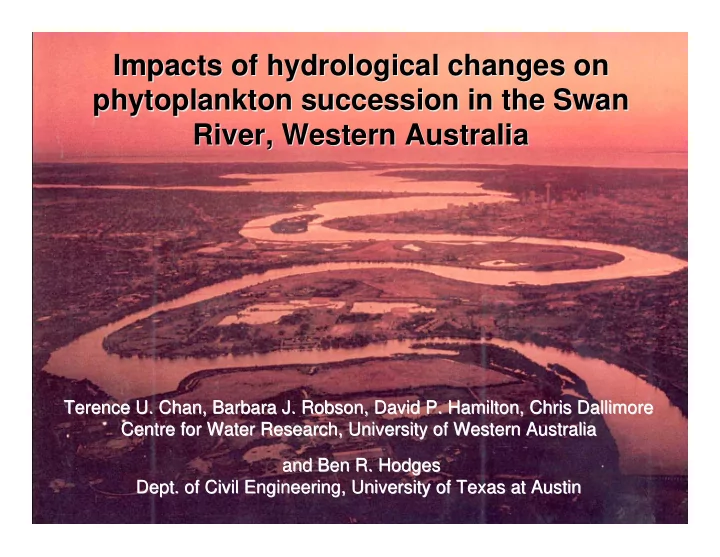

Impacts of hydrological changes on Impacts of hydrological changes on phytoplankton succession in the Swan phytoplankton succession in the Swan River, Western Australia River, Western Australia Terence U. Chan, Barbara J. Robson, David P. Hamilton, Chris Dallimore Terence U. Chan, Barbara J. Robson, David P. Hamilton, Chris Dallimore Centre for Water Research, University of Western Australia Centre for Water Research, University of Western Australia and Ben R. Hodges and Ben R. Hodges Dept. of Civil Engineering, University of Texas at Austin Dept. of Civil Engineering, University of Texas at Austin
Upper Swan River estuary phytoplankton succession Objective: determine to what extent this succession is the result of anthropogenic changes summer autumn winter spring summer
The Swan-Avon Catchment Perth 121,000 km 2
Hydrological Hydrological changes changes • Extensive clearing for agriculture (~35% remains natural) Extensive clearing for agriculture (~35% remains natural) • • Urbanization around estuary • Urbanization around estuary • Construction of reservoirs Construction of reservoirs • • River River “ “training training” ” to handle increased flows to handle increased flows • • Removal of estuary sill Removal of estuary sill •
Agricultural clearing Agricultural clearing with minimal retention with minimal retention of riparian zone of riparian zone
Urban drains and groundwater intrusion dominate the summer inflows in the estuary Perth
350 Present hydrology 90% of the 25 annual inflow 1.2
Catchment effects of Catchment effects of anthropogenic changes anthropogenic changes Avon “ “River River” ” Avon during the during the summer summer Based on Based on LASCAM LASCAM model of Viney Viney model of and Sivapalan Sivapalan and Increased runoff due to clearing Increased runoff due to clearing ~ 5 fold ~ 5 fold Increased nutrient loads from agriculture Increased nutrient loads from agriculture ~ 16 fold ~ 16 fold Increased sediment yield Increased sediment yield ~ 40 fold ~ 40 fold
Salt-wedge estuary during Sill at 2m summer in the deepened upper reaches to 14 m Salinity field data, Sept 26, 1995 to July 1, 1996
“Snapshot” comparison of field data and 3D hydrodynamic model ELCOM
Computational Aquatic Ecosystem Dynamics Model CAEDYM
lines = CAEDYM/ELCOM model points = field data
field vs base case simulation field data baseline model results
Model scenarios Model scenarios Reduced catchment flows Reduced catchment flows Reduced nutrient loads Reduced nutrient loads Removal of reservoirs Removal of reservoirs Restoration of Fremantle sill Restoration of Fremantle sill
baseline ELCOM model salinity results reduced catchment flows
baseline CAEDYM- ELCOM model chlorophyte results reduced catchment flows and nutrients
baseline model results reservoirs removed model results
baseline model results reduced nutrient load model results
baseline model results reduced nutrient load and reduced flow model results
reduced nutrient load model results reduced nutrient load and reduced flow model results
Work in progress – effect of the sill on salinity baseline ELCOM model results sill restored
Further Work Further Work Apply longer run-up time to reduce Apply longer run-up time to reduce initialization artifacts initialization artifacts Model management targets for reduced Model management targets for reduced nutrient loads nutrient loads
Conclusions Calibrated 3D model for water quality can capture phytoplankton succession in the Swan River estuary Anthropogenic nutrient loads have increased phytoplankton biomass Phytoplankton succession appears altered by changes in flow and loads
Acknowledgements • Western Australian Estuarine Research Foundation (WAERF) • Water and Rivers Commission of Western Australia (W&RC); • WA Department of Transport; • WA Department of Environmental Protection; • Dr. David Horn
For further info contact: jackson@cwr.uwa.edu.au
Recommend
More recommend