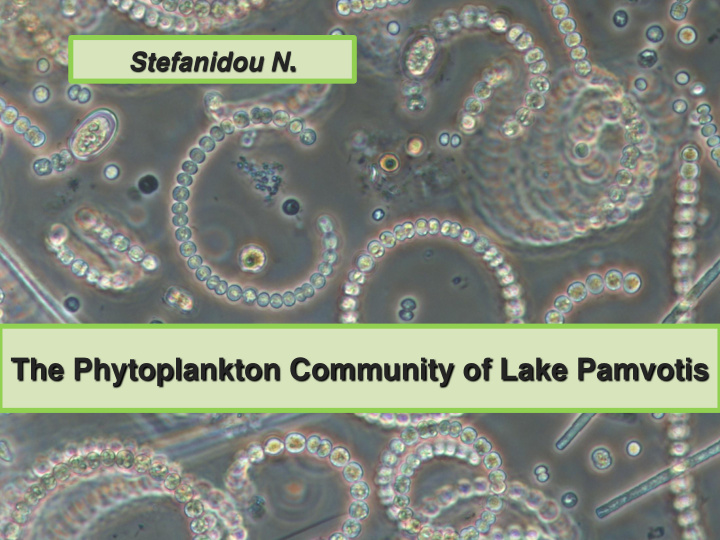


Stefanidou N . The Phytoplankton Community of Lake Pamvotis
Methodology A map of the area Estimation of the water quality according to: July-December 2011 i) The total phytoplankton biovolume (mm 3 L -1 ) ii) Percentage (%) contribution of Cyanobacteria in total biovolume iii) Assemblage index Q ( Padisák et al. 2006 ) iv) Phytoplankton’s blooms v) Thresholds guidance of the World Health Organization (WHO) for safe us age of recreational water vi) Presence of the gene (mcyA) for Urban areas (8%) production of dangerous toxins Agricultural areas (45%) (microcytines) Forests (42%)
Estimation of the Water Quality 1. High levels of phytoplankton biovolume 2. Dominance of Cyanobacteria 3. Frequent, long-lasting water blooms
Estimation of the Water Quality 4. Low levels of index Q 5. Break of the guidance thresholds established by (WHO) for safe usage of the Water 6. Occurrence of toxic blooms
Bad Water Quality Lake Pamvotis
Aphanizomenon flos- aque Anabaena affinis Anabaena flos-aque Microcystis panniformis Cyanodictyon imperfectum Microcystis auraginosa
Recommend
More recommend