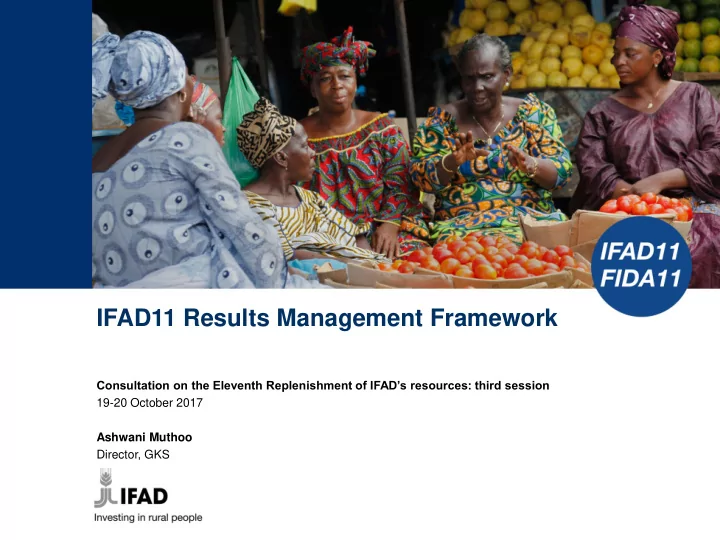

IFAD11 Results Management Framework Consultation on the Eleventh Replenishment of IFAD’s resources: third session 19-20 October 2017 Ashwani Muthoo Director, GKS
Contents of presentation Brief overview of the 2017 Report on IFAD’s Development Effectiveness IFAD11 Results Management Framework 1
Report on IFAD’s Development Effectiveness (RIDE) 3
Improvements in results in the past decade 100 2017 90 2007 moderately satisfactory or above Percentage of projects rated 80 70 60 50 40 30 20 10 0 Innovation Effectiveness Government Efficiency Sustainability Environmental performance of benefits and natural resource management 2
2017 RIDE – Areas of challenge are similar to independent evaluations 100 90 moderately satisfactory or above Percentage of projects rated 80 70 60 50 93 92 90 77 78 88 40 30 20 10 0 Innovation Scaling-up Government Efficiency Sustainability Environmental performance of benefits and natural resource management 3
2017 RIDE – Operational and institutional effectiveness IFAD10 target Indicators 2016 Status (2018) Overall rating for quality 93.3 90 of design 1.27 1.2 Co-financing ratio Time to fill professional 91 100 vacancies (days) Time from project approval to 16.8 14 first disbursement (months) Percentage disbursement 12.8 15 ratio (overall portfolio) Percentage of women in P-5 25 35 posts and above 4
Response to ARRI and RIDE Moving beyond moderately satisfactory Key initiatives Operational Excellence for results (OpEx) Development IFAD11 Effectiveness Business Model Framework Expected improvements Enhancing operational 1 effectiveness Maximizing impact 2 on the ground Improving institutional 3 efficiency 4 Greater results focus 5
Results Management Framework (RMF) 6
IFAD11 RMF New features compared to IFAD10 RMF IFAD10 IFAD11 Results Reporting Tool Results Management Tool Limited alignment to IFAD’s evolving Aligned with IFAD11 Business Model and IFAD Strategic Framework 2016-2025 Business Model Streamlined three-tier structure Composed of Five levels Self-assessment, independent evaluation, and Self-assessment data disaggregated reporting Non-lending activities and mainstreamed All non-lending activities and mainstreamed areas only partly monitored areas fully monitored Integrates IFAD’s Value -for-money proposition No reflection of Value-for-Money 6
IFAD11 RMF Theory of change 7-A
IFAD11 RMF Theory of change SDG 1.1.1 Proportion of population below the international poverty line of US$1.90 a day SDG 2.1.2 Prevalence of food insecurity SDG 2.2.1 Prevalence of stunting among children under 5 years of age SDG 2.2.2 Prevalence of malnutrition SDG 2.3.2 Average income of small-scale food producers SDG 2.a.2 Total official flows to the agriculture sector (billions of United States dollars) SDG 2.a.1 Government expenditure on agriculture (index) 7-B
IFAD11 RMF Theory of change IFAD10 target 40 million people IFAD10 target IFAD10 IFAD10 42 million target target people 22 million 43 million people people *Based on a proposed PoLG of US$3.5 billion for IFAD11 7-C
IFAD11 RMF Theory of change • Ratio of debt to • Resource • Non-lending • Decentralization equity allocations to activities and ratio country groups SSTC • Co-financing ratio • Institutional • Appropriateness of • Disbursement ratio efficiency project-level targeting 7-D
Measuring mainstreaming in IFAD11 Youth Gender Nutrition Climate South-South Change and Triangular Cooperation Tier 2 Tier 2 Tier 2 Tier 1 Tier 3 8 people-centered 8 people-centered project-level 2 SDG2 indicators % of COSOPs with output indicators output indicators outcome rating related to nutrition an elaborate on “Adaptation to disaggregated disaggregated by approach to SSTC Climate Change” by youth gender Tier 2 # of persons/households Tier 2 2 project-level provided with output indicators targeted support to improve their nutrition 8
IFAD and Value-for-Money Decreasing Expanding Amplifying Prioritizing the IFAD’s scale of costs keeping impact through poorest people level and quality operation partnerships and the poorest of outputs countries • Time from concept • Resources leveraged • Country-level policy • Share of core note to approval through borrowing engagement resources allocated to LICs and LMICS • Time from project • Country selectively • Partnership building • Appropriateness of approval to first • Project-level • Co-financing ratio disbursement targeting in IFAD efficiency • Development projects • Disbursement ratio • Institutional efficiency Effectiveness • Men, women and Framework youth reached 9
Thank you Investing in rural people 10
Recommend
More recommend