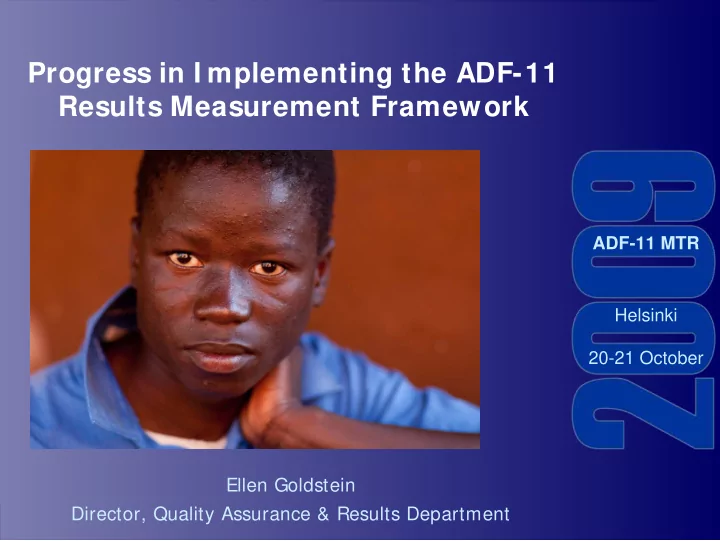

Progress in I mplementing the ADF-11 Results Measurement Framework ADF-11 MTR Helsinki 20-21 October Ellen Goldstein Director, Quality Assurance & Results Department
Results Results Framework Framework ADF- -11 Results Measurement Framework 11 Results Measurement Framework ADF Tier I Tier I Tier I Progress on country Progress on country COUNTRY OUTCOMES COUNTRY OUTCOMES outcomes outcomes OUTCOMES OUTCOMES Tier I I Tier I I Tier I I Contribution of Bank Contribution of Bank operations operations OUTPUTS OUTPUTS ACTI VI TI ES ACTI VI TI ES Tier I I Tier I I Tier I I Bank effectiveness & Bank effectiveness & performance performance I NPUTS I NPUTS 1
Outline Outline Today’ ’s Presentation s Presentation Today 1 Progress on Country Outcomes 2 Contribution of Bank Operations 3 Bank Effectiveness and Performance 2
Country Country Outcomes Outcomes Assessing Progress on Country Outcomes Assessing Progress on Country Outcomes � Growth/ poverty reduction/ human development- Continued strong growth and social progress in 2008. � Regional integration/ trade – Commodity boom helped raise Africa’s share of global trade to 3% in 2008. � Private sector and investment climate – Steady improvement in country indicators. o I nfrastructure – Assessment difficult, improvements in water supply and telecommunications. o Governance – No reliable assessment of short-term change. Increased engagement in PEFA and EITI. 3
Output & Output & Outcomes Outcomes Today’ ’s Presentation s Presentation Today 1 Progress on Country Outcomes 2 Contribution of Bank Operations 3 Bank Effectiveness and Performance 4
Output & Output & Outcomes Outcomes Assessing the Contribution of Bank Operations o Improved ability to track outputs and outcomes through more comprehensive completion reporting (72% ) o Strong delivery of planned outputs , with nearly 75% of output indicators achieving/ exceeding expectations. o Evidence that outputs contributed to measurable improvements in outcomes across various ADF priorities . 5
Output & Output & Outcomes Outcomes Selected Outputs and Outcomes TRANSPORT POWER � � Roads constructed: 4,211km Transmission lines: 3,154 km � � Feeder roads: 8,594 km Power capacity installed: 200 MW � People with improved access: � 41.6 million People with new electricity connections: 16.6 million WATER SUPPLY AGRICULTURE � � Wells drilled: 3,641 Improved use of land: 484,560 hectares � Capacity for drinking water � provided: 332,411 m 3 Heads of livestock provided/vaccinated: 59,373 � People with new access: � 1.7 million. Farmers trained: 416,815 6
Effectiveness Effectiveness & performance & performance Today’ ’s Presentation s Presentation Today 1 Progress on Country Outcomes 2 Contribution of Bank Operations 3 Bank Effectiveness and Performance 7
Effectiveness Effectiveness & performance & performance The Action Plan for Quality & Results The Action Plan for Quality & Results 1 Decentralization 2 Quality at Entry 3 Portfolio Supervision 4 Ex-post Evaluation 5 Data and Results Reporting 8
Effectiveness Effectiveness & performance & performance Accelerating Decentralization Decentralization Accelerating 2010 Target 2006/07 June 09 5% % of professional 15% staff in FO 15% % of portfolio 0% 15% managed from FO 7% % of aid in common 40% 55% arrangements 37% 19% % of joint missions 25% 17% 9
Effectiveness Effectiveness & performance & performance Enhancing Quality at Entry Enhancing Quality at Entry 2006/07 June 09 2010 Target Country strategies with 33% satisf. baseline data at 60% 38% entry Operations with 37% satisfactory baseline 60% 50% data at entry 55% Budget support 75% disbursed on schedule 69% Time from approval to 24 months 12 months disbursement 16 months 10
Effectiveness Effectiveness & performance & performance Instilling Results- -based Supervision based Supervision Instilling Results 2006/ 07 June 09 2010 Target Annual disbursement rate 18% 22% of on ‐ going portfolio 21% Share of operations 36% supervised at least twice a 50% 45% year 70 weeks Average elapsed 40 weeks procurement time (weeks) 58 weeks 11
Effectiveness Effectiveness & performance & performance Enhancing Evaluation for Learning Enhancing Evaluation for Learning 2010 Target 2006/ 07 June 09 2% 45% Timely PCR coverage 96% � 47% of 2008 PCRs have gender disaggregated data. 12
Effectiveness Effectiveness & performance & performance Strengthening Data and Results Reporting Strengthening Data and Results Reporting 15% 96% o Core output and outcome indicators adopted for key sectors o Prototype of web-based Results Reporting System links logical framework, supervision and completion reporting 13
Action Plan Action Plan Implementation Implementation Sustained Implementation of Action Plan Sustained Implementation of Action Plan o DECENTRALIZATION • Transfer task management responsibilities . • Decentralize fiduciary decision-making . o QUALITY AT ENTRY • Mainstream Readiness Reviews . • Develop frontier training on quality and results. o PORTFOLIO SUPERVISION • Revise supervision reporting to focus on results. • Build field office capacity . 14
Action Plan Action Plan Implementation Implementation Sustained Implementation of Action Plan Sustained Implementation of Action Plan (continued) (continued) o EVALUATION • Maintain momentum on completion reporting. • Incorporate lessons learned. o DATA AND RESULTS REPORTING • Mainstream core sector indicators . • Roll out results reporting system. o PARTNERSHIP FOR AID EFFECTIVENESS • Adhere to Paris Declaration principles. • Sponsor Africa regional platform for country capacity. 15
16 Thank You
Recommend
More recommend