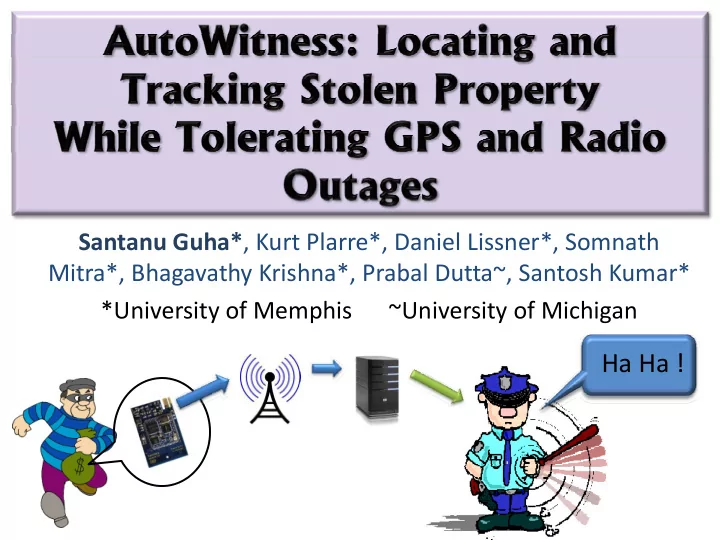

Santanu Guha* , Kurt Plarre*, Daniel Lissner*, Somnath Mitra*, Bhagavathy Krishna*, Prabal Dutta~, Santosh Kumar* *University of Memphis ~University of Michigan Ha Ha !
In United States: Over 2 million reported burglaries in 2009 ~ An average $ 2000 loss per incident
Existing Theft Detection Systems • Either deter or detect burglary incidents
Existing Tracking Systems • Radio Outages • Unsuitable for smaller assets
We need a system that is… Stealthy 2 years 1 year Long Life Immune to Radio Outages
Our “AutoWitness” system Detects Burglary Autonomously • Using Vehicular Movement as an identifier of theft Tracks Asset, Pinpoints Final Location • Using a HMM based model to track burglars using only inertial estimates.
AutoWitness Tag Node Server Embedded in Used for Map expensive items Matching
How does AutoWitness work ? Autonomous Detection of Burglary by the Tag Node
Vehicular Movement Indicates Theft
How does AutoWitness work ? Autonomous Detection of Burglary by the Tag Node Detection of Theft initiates tracking of assets
Cell Tower Map Matching • HMM • City Map AutoWitness Server
How does AutoWitness work? Autonomous Detection of Burglary by the Tag Node Detection of Theft initiates tracking of assets Track is provided to law enforcement officials when cell tower is available completing the process of asset recovery
Cell Tower Map Matching Asset • HMM Location • City Map AutoWitness Server
Thank you AutoWitness ! • Classifies Theft by Detecting Vehicular Signature • Produce inertial estimates using accelerometers and gyroscopes • Computes track of burglar using a HMM • Informs the Police
Key System Challenges: AutoWitness Real Life Deployment presents several system challenges Challenges • Tag Node • Server
Key System Challenges: Tag Node Producing Accurate Inertial Estimates Choosing Re ‐ orientating appropriate Tag Node Hardware Developing Theft Classifier
Choice of Hardware for Tag Node Wake Up Circuit Vibration Dosimeter • Filters out insignificant vibrations and prolongs tag node lifetime
Choice of Hardware for Tag Node Distance = d Angle = Θ • 3 axis accelerometer • 3 axis Gyroscope
Choice of Hardware for Tag Node Choice of Hardware for Tag Node Cell Tower AutoWitness Server • A GSM \ GPRS modem All integrated in a Epic Core Platform
Light Weight detection of burglary on Tag Node Vehicular movement is taken Significant as indicator of theft Vibrations Accelerometers Extensive Data Collected for different movement Decision scenarios Tree Classifier Built using 10 fold Theft cross validation in Weka
Producing Accurate Inertial Estimates Producing accurate inertial estimates • Distance Computation using inertial sensors ‐ Remove noise ‐ Re ‐ orient Tag Node ‐ Correct for Radial Acceleration ‐ Correct for drift
Distance Computation • Remove Noise • Subtract Mean between stops to correct drift • Double Integrate Also remove component radial acceleration for curves
Distance Computation All Filtration Distance Error < 12.6 % Steps No Reorientation No Radial Acceleration Correction No Drift Correction
Key System Challenges: Server Side Using only Inertial Estimates Pinpoint the Reconstruct the asset’s final path driven by location burglar
Reconstruct Path driven by Burglar Hidden Markov Model Start P (Si|Start) Existing Systems using HMM for State i State j map matching require GPS P (Oi|State i) coordinates as P (State j|State i) inputs Observable i
Start Probabilities Start states emerge from Intersections within uncertainty range Stolen item No of Intersections = 4 original location Start Probability = 1/4
Transition Probabilities (TPs) We want to Error Range of Distance Computation Gets highest TP assign TPs since closest to measured distance From the system’s d perspective Gets TP proportional to their distance States are from actual Road measured dist Segments
Observables Speed of the Car ? Curvatures of Roads ? Sequence of distances between every pair of turns and/or stops experienced by the burglar’s car
Let’s say there are two road Road Segment A segments of identical length Discrimination using location Road Segment B of traffic lights on roads
Real Life Test
Real Life Test ‐ Return Path
Evaluations at Scale Set up for the evaluations: • We used Openstreetmap.org GIS data base • Chose 100 different locations through out the city as our starting locations • Fort each stating location chose 10 different directions for a fixed travelled distance • Created synthetic paths from the database marking a set of intersections as STOP
Evaluations of Map Matching 92 % 73 % Max Distance Computation Error Stopping Sequence, Localization at Destination
Evaluations of Map Matching 98 % 93 % Max Distance Computation Error Stopping Sequence, Localization at each Turn
Conclusions • Achieves over 90% accuracy in identifying the path driven by the burglar using inertial estimates • Immune to Radio Outages • Life Time prolonged due to filtration by Vibration Dosimeter Future Work • Locate apartment or house of the burglar
Traffic light pinned as it falls within error margin Road Segment A Stopping estimates refined by pinning to matched traffic lights RS B pruned as no Road Segment B Stops traffic light matched
Both lights within the error range Branch 1 Branch 2
Evaluations of Map Matching 91 % Chance Cumulative Prob. of correct path in K top weighted paths
Recommend
More recommend