Evaluation of Memory and CPU usage via Cgroups of ATLAS workloads - PowerPoint PPT Presentation
Evaluation of Memory and CPU usage Evaluation of Memory and CPU usage via Cgroups of ATLAS workloads via Cgroups of ATLAS workloads running at a Tier-2 running at a Tier-2 Gang Qin, Gareth Roy Ma March rch. 25 th , 2015 Condor Cgroups
Evaluation of Memory and CPU usage Evaluation of Memory and CPU usage via Cgroups of ATLAS workloads via Cgroups of ATLAS workloads running at a Tier-2 running at a Tier-2 —— Gang Qin, Gareth Roy Ma March rch. 25 th , 2015
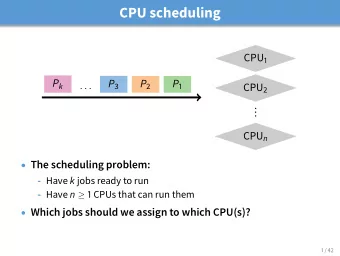
Condor Cgroups Control Groups (Cgroups) • Linux kernel feature to limit/isolate resource usage among user-defined groups of tasks(processes). • Available Resource Controllers (or subsystems): – Block-I/O,cpu/cpuacct/cpuset/devices/freezer/memory/net_cls/net_prio/ns Condor Cgroups • Condor puts each job into a dedicated cgroup for a selected subsystem • Can be used to track the subsystem usage of all processes started by a job • control cpu usage at job level: – Jobs can use more cpu than allocated if there are still free cpu • control RSS (physical memory) usage at job level: – soft : jobs can access more memory than allocated if there is still free physical memory available in the system – hard : jobs can't access more physical memory than allocated
Condor Cgroups Control Groups (Cgroups) • Linux kernel feature to limit/isolate resource usage among user-defined groups of tasks(processes). • Available Resource Controllers (or subsystems): – Block-I/O,cpu/cpuacct/cpuset/devices/freezer/memory/net_cls/net_prio/ns Condor Cgroups • Condor puts each job into a dedicated cgroup for a selected subsystem • Can be used to track the subsystem usage of all processes started by a job • control cpu usage at job level: – Jobs can use more cpu than allocated if there are still free cpu • control RSS (physical memory) usage at job level: – soft : jobs can access more memory than allocated if there is still free physical memory available in the system – hard : jobs can't access more physical memory than allocated
Glasgow Tier-2 Glasgow Condor Cluster • Production instance since Aug 2014, has received ~ 1.3 million jobs, comprises 2 ARC- CE(8/16 core), 1 condor central server (8core), 42 worker-nodes (1456 logical cores) MySQL Databases: • Condor: select/record historical info of condor jobs, incuding ClusterId/GlobalJobId/JobStatus/ExitCode/LastJobStatus/RequestCpus/RequestMemory/J obMemoryLimit/JobTimeLimit/Use/RemoteWallClockTime/RemoteSysCpu and etc.. • Panda: PandaID of finished/failed jobs in GLASGOW panda queues Memory/Cpu info collection from cgroups: • Cgmemd collects the following every minute for each job (on each WN): – Cputime: total CPU time consumed by all tasks in the job (later converted into the regular CPU usage by comparing 2 neighbouring sampling points): – RSS: instantaneous physical memory usage of the job – SWAP: instantaneous swap usage of the job • Memory = RSS + SWAP ATLAS job Info tracking: • GlobalJobId, trfName(last one), PandaID (last one) Analysis • Currently focus on ATLAS good jobs
ATLAS jobs at Glasgow Tier-2 Empty Pilots • runs 2 or 3 minutes, using ~25MB memory with CPU usage < 0.1 Production jobs: • Multi-core: – panda_queue = UKI-SCOTGRID-GLASGOW_MCORE – Request_cpu = 8 & Req_memory = 16 GB – Site policy: RSS > 16GB not allowed, no restriction on SWAP • Single-core: – panda_queue = UKI-SCOTGRID-GLASGOW_SL6 – Request_cpu = 1 & Request_memory = 3 GB – Site policy: RSS > 3GB not allowed, no restriction on SWAP • GlobalJobId – PandaID: one pilot picks <= 1 production job Analysis jobs: • panda_queue = ANALY_GLASGOW_SL6 • Request_cpu = 1 & Request_memory = 4GB • Site restriction: RSS > 4 GB not allowed, no restriction on SWAP • GlobalJobId – PandaID : one pilot could pick >1 analysis jobs Selection of Good Jobs: • finished successfully both in condor and Panda
Multicore Simulation Jobs
Multicore Reconstruction Jobs
Lifetime of Singlecore Production Jobs Among all the jobs, ~41% finished within 2 hours, ~56% finished between 2 and 20 hours, ~2.3% runs >20 hours.
MaxMemory of Singlecore Production Jobs Among all the jobs, ~95% use < 1.2 GB, ~ 4.9% use within 1.2GB and 2GB range, <0.1% uses >2GB, none uses > 4GB
Averaged Cpu of Singlecore Production Jobs All < 1 except a few Generate_trf.py jobs
Averaged Cpu of Singlecore Production Jobs All < 1 except a few Generate_trf.py jobs
Lifetime Distribution of Analysis Jobs Among all the analysis jobs, ~63% finished within 2 hours, ~33% finished between 2 and 20 hours, 4% runs >20 hours.
MaxMemory of Analysis Jobs Among all the analysis jobs, ~94.5% use <1.5GB, ~5% uses 1.5-3GB, 0.2% uses >3GB.
Averaged CPU of Analysis Jobs ~1% jobs use > 1 cpu, known as Madevents jobs created by Madgraph
Test of Madgraph jobs Test node: node046, 24 core, 24GB physical memory, 24GB swap Test 1: run madgraph in default mode, e.g. without setting –nb_core Test 2: run madgraph with 1 and 20 processes separately, both in parallel with another condor job which stressed the other 23 cores all the time.
Memory Overcommit Balance between Job's memory over-requesting and high resource usage • Optimization is difficult due to job's complexity and WN variation ATLAS jobs: Request_ Request_M MAX_MEM_us Request Ideal CPU EM ed Mem/cpu Mem/cpu 1.2 GB PRODUCTION 1 3GB 95% < 1.2GB 3 GB 2 GB 8 16GB [2-8],[8-16] 2 GB 1.5 GB ANALYSIS 1 4GB 94.5% < 1.5GB 4 GB • Multicore production jobs: request memory close to real usage • Single core jobs: request ~150% than real usage • ATLAS is planning to use RSS & SWAP to replace MEMORY in job description Site policy: • RSS > 2GB/CPU: overcommit_factor >= 2 • RSS < 2GB/CPU: overcommit_factor < 2
Broken Multicore Jobs Jobs could get broken at any step, and a broken job takes 48 hours (384 cpu- hours) while a normal multicore job only takes ~ 2 hours Suspicous job detecting system setup to track/kill suspicious multicore jobs • Reco_tf.py: cpu usage dropped to ~0.4 and memory usage unchanged • Sim_tf.py: running time > 10 hours (old Sim_tf.py jobs)
Future Work Rerun the analysis on larger time scale Monthly calibation • To detect the change of Job properties • Update local resource policy correspondingly Integration into site monitoring/security tools • Online tracking of cpu/memory footprints of selected job • Online tracking of suspicous jobs – Enable the killing of broken multicore reconstruction jobs Expand the analysis to more VOs • CMS? • Small VOs?
Questions? Questions?
Recommend
More recommend
Explore More Topics
Stay informed with curated content and fresh updates.

