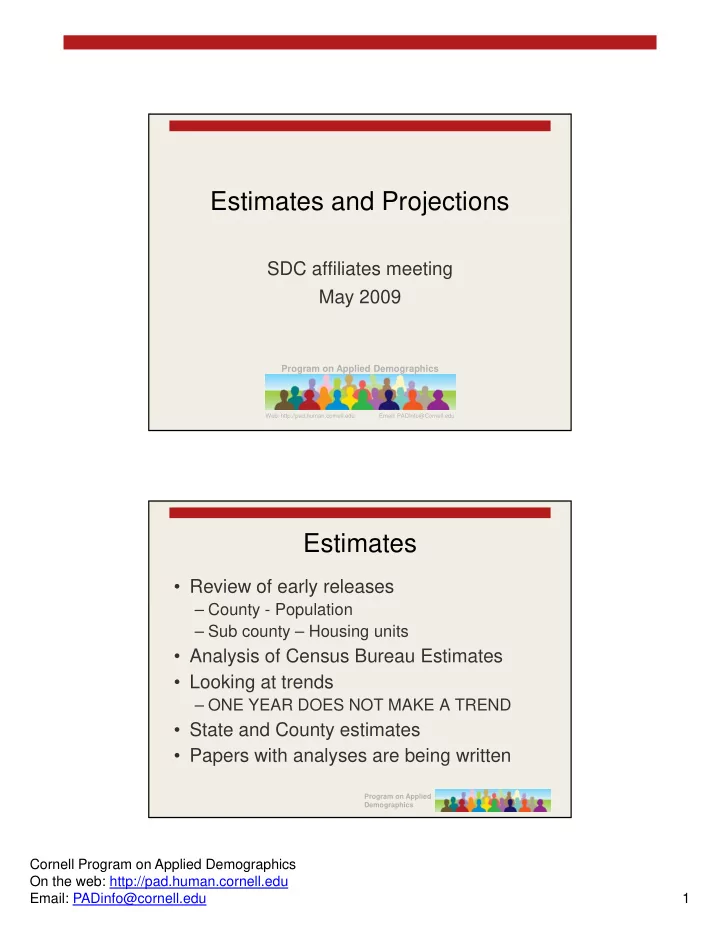

Estimates and Projections SDC affiliates meeting May 2009 Program on Applied Demographics Web: http://pad.human.cornell.edu Email: PADInfo@Cornell.edu Estimates • Review of early releases – County - Population Co nt Pop lation – Sub county – Housing units • Analysis of Census Bureau Estimates • Looking at trends – ONE YEAR DOES NOT MAKE A TREND • State and County estimates • Papers with analyses are being written Program on Applied Demographics Cornell Program on Applied Demographics On the web: http://pad.human.cornell.edu Email: PADinfo@cornell.edu 1
State Estimates • Comparing change from 2000-2004 with change 2004-2008 h 2004 2008 Program on Applied Demographics Population change 2000-2004 Program on Applied Demographics Cornell Program on Applied Demographics On the web: http://pad.human.cornell.edu Email: PADinfo@cornell.edu 2
Population change 2004-2008 Program on Applied Demographics Percent Change in State Population 16 14 AZ AZ Percent Change 2004-2008 UT 12 NV 10 ID GA TX NC 8 CO SC 6 WY FL 4 OK AL CA State changes AK 2 IA NH US total change P MD MD ND ND NY 0 WV 1 Standard Deviation MI Equal Growth LA -2 RI -2 0 2 4 6 8 10 12 14 16 Percent Change 2000-2004 Program on Applied Demographics Cornell Program on Applied Demographics On the web: http://pad.human.cornell.edu Email: PADinfo@cornell.edu 3
Average annual growth by cluster 3.5% 3.0% Average percentage growth 2.5% 1 2.0% 2 3 4 1.5% 5 1.0% 0.5% 0.0% 2001 2002 2003 2004 2005 2006 2007 2008 Year (end of period) Program on Applied Demographics Program on Applied Demographics Cornell Program on Applied Demographics On the web: http://pad.human.cornell.edu Email: PADinfo@cornell.edu 4
NH GA NM Deaths ID Domestic VA MD International WA Migration MN WY Migration RI IL AL AZ AZ AK AK TX NV NV MS AR CA CA MO DC DC CO NE DE NC HI OK IN PA NJ NJ NJ NY NY NY NY KS SC KY FL FL SD LA TN TN MA MA ME UT MI MI VT CT WV OH IA OR MT WI ND Births Program on Applied Demographics Region/County Estimates • Look at components of change • Comparing change from 2000-2004 with change 2004-2008 Program on Applied Demographics Cornell Program on Applied Demographics On the web: http://pad.human.cornell.edu Email: PADinfo@cornell.edu 5
Figure 1. Rate of Change in Population Due to Natural Increase and Net Migration, 2000-2008 8.0% Population Natural Increase 6.0% Net Migration 4.0% Rates of Change 2.0% 0.0% -2.0% -4.0% -6.0% Capital Central Finger Long Island Mid- Mohawk New York North Southern Western Lakes Hudson Valley City Country Tier Region Program on Applied Demographics 4% 3% New York City 2% Mid-Hudson Capital % Growth 2004-2008 North Country 1% NY State Long Island 0% -3% -2% -1% 0% 1% 2% 3% 4% Mohawk Valley Finger Lakes -1% Central Central Southern Tier Western -2% -3% % Growth 2000-2004 Program on Applied Demographics Cornell Program on Applied Demographics On the web: http://pad.human.cornell.edu Email: PADinfo@cornell.edu 6
Program on Applied Demographics 8% 6% 4% % Growth 2004-2008 RIC ORA KIN BRX JEF SCH NEW SAR 2% QUE TOM FRA DUT SUF MTG WES 0% -4% LEW -2% 0% 2% PUT 4% 6% 8% NAS OTS -2% ALL SEN ORL ERI HAM CAT -4% % Growth 2000-2004 Program on Applied Demographics Cornell Program on Applied Demographics On the web: http://pad.human.cornell.edu Email: PADinfo@cornell.edu 7
Projections • Small adjustments with release of new C Census Bureau County estimates B C t ti t • Web site redesigned – New user interface • Documentation and Assumptions now online online Program on Applied Demographics Cornell Program on Applied Demographics On the web: http://pad.human.cornell.edu Email: PADinfo@cornell.edu 8
Recommend
More recommend