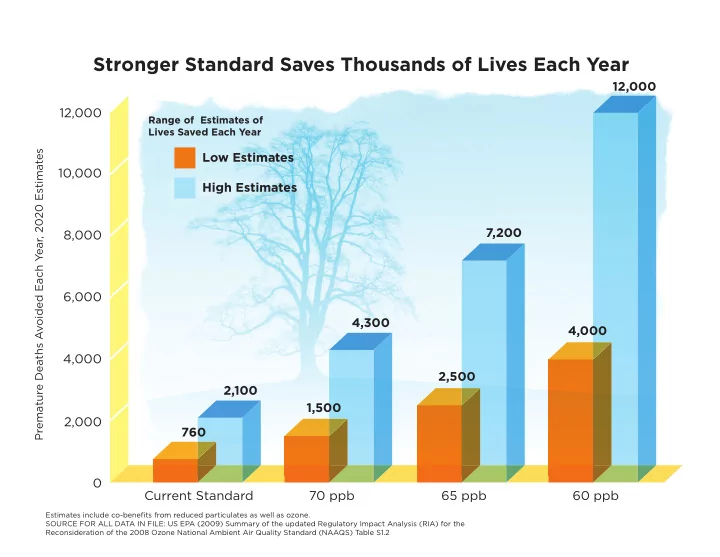

Stronger Standard Saves Thousands of Lives Each Year 12,000 12,000 Range of Estimates of Lives Saved Each Year Premature Deaths Avoided Each Year, 2020 Estimates Low Estimates 10,000 High Estimates 7,200 8,000 6,000 4,300 4,000 4,000 2,500 2,100 1,500 2,000 760 0 Current Standard 70 ppb 65 ppb 60 ppb Estimates include co-benefits from reduced particulates as well as ozone. SOURCE FOR ALL DATA IN FILE: US EPA (2009) Summary of the updated Regulatory Impact Analysis (RIA) for the Reconsideration of the 2008 Ozone National Ambient Air Quality Standard (NAAQS) Table S1.2
Stronger Ozone Standard Prevents More Asthma Attacks 58,000 58, 60,000 58,000 Asthma Attacks Would NOT Happen Each Year Asthma Attacks Prevented Each Year, 2020 Estimates 50,000 38,000 40,000 30,000 23,000 20,000 12,000 10,000 0 Current Standard 70 ppb 65 ppb 60 ppb Estimates include co-benefits from reduced particulates as well as ozone. SOURCE FOR ALL DATA IN FILE: US EPA (2009) Summary of the updated Regulatory Impact Analysis (RIA) for the Reconsideration of the 2008 Ozone National Ambient Air Quality Standard (NAAQS) Table S1.2
Stronger Ozone Standard Prevents Thousands of Hospital and Emergency Department Visits 25,000 21,000 Fewer 21,000 Hospital and Emergency Dept. Hospital/Emergency Department Admissions 20,000 Visits Each Year Prevented Each Year, 2020 Estimates 15,000 11,000 10,000 6,700 5,000 2,600 0 Current Standard 70 ppb 65 ppb 60 ppb Estimates include co-benefits from reduced particulates as well as ozone. SOURCE FOR ALL DATA IN FILE: US EPA (2009) Summary of the updated Regulatory Impact Analysis (RIA) for the Reconsideration of the 2008 Ozone National Ambient Air Quality Standard (NAAQS) Table S1.2
Stronger Standard Means Fewer Heart Attacks 6,000 Stronger standard 5,300 5,3 means 5,300 fewer heart attacks each year Heart Attacks Prevented Each Year, 2020 Estimates 5,000 3,500 4,000 3,000 2,200 2,000 1,300 1,000 0 Current Standard 70 ppb 65 ppb 60 ppb Estimates include co-benefits from reduced particulates as well as ozone. SOURCE FOR ALL DATA IN FILE: US EPA (2009) Summary of the updated Regulatory Impact Analysis (RIA) for the Reconsideration of the 2008 Ozone National Ambient Air Quality Standard (NAAQS) Table S1.2
Stronger Ozone Standard Means Fewer Days Missed at Work and School Each Year 2,500,000 Work or School Absences Avoided Each Year, 2020 Estimates 2,100,000 Current Standard 2,000,000 70 ppb 65 ppb 60 ppb 1,500,000 1,100,000 1,000,000 600,000 420,000 500,000 270,000 190,000 170,000 88,000 0 Days NOT Missed at School Days NOT Missed at Work Estimates include co-benefits from reduced particulates as well as ozone. FOR ALL DATA IN FILE: US EPA (2009) Summary of the updated Regulatory Impact Analysis (RIA) for the Reconsideration of the 2008 Ozone National Ambient Air Quality Standard (NAAQS) Table S1.2
Recommend
More recommend