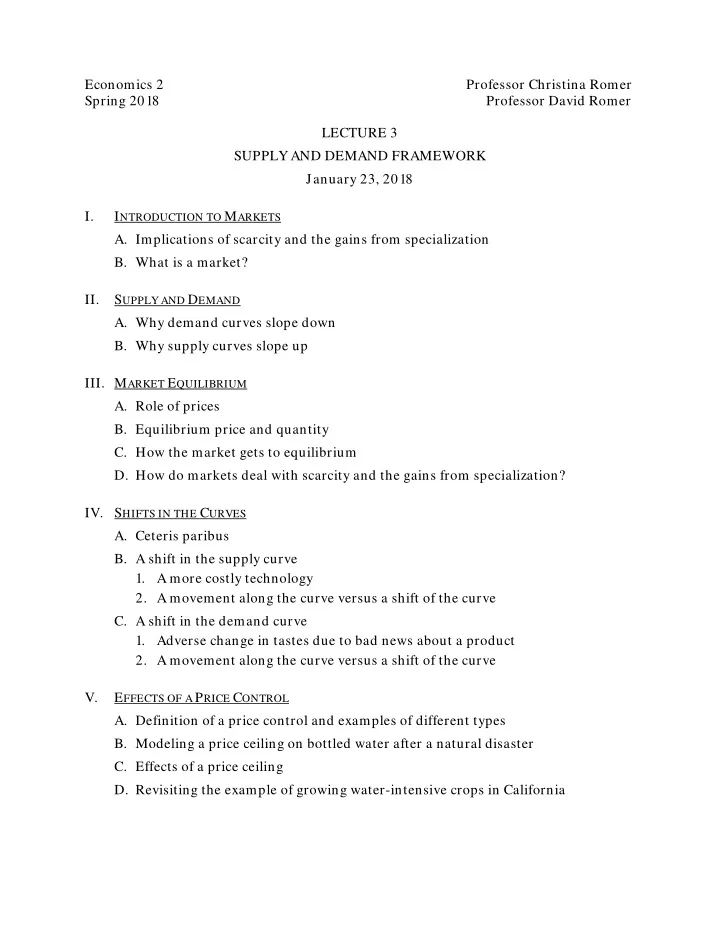

Economics 2 Professor Christina Romer Spring 2018 Professor David Romer LECTURE 3 SUPPLY AND DEMAND FRAMEWORK January 23, 2018 I. I NTRODUCTION TO M ARKETS A. Implications of scarcity and the gains from specialization B. What is a market? II. S UPPLY AND D EMAND A. Why demand curves slope down B. Why supply curves slope up III. M ARKET E QUILIBRIUM A. Role of prices B. Equilibrium price and quantity C. How the market gets to equilibrium D. How do markets deal with scarcity and the gains from specialization? IV. S HIFTS IN THE C URVES A. Ceteris paribus B. A shift in the supply curve 1. A more costly technology 2. A movement along the curve versus a shift of the curve C. A shift in the demand curve 1. Adverse change in tastes due to bad news about a product 2. A movement along the curve versus a shift of the curve V. E FFECTS OF A P RICE C ONTROL A. Definition of a price control and examples of different types B. Modeling a price ceiling on bottled water after a natural disaster C. Effects of a price ceiling D. Revisiting the example of growing water-intensive crops in California
Economics 2 Christina Romer Spring 2018 David Romer L ECTURE 3 Supply and Demand Framework January 23, 2018
Announcements • Problem Set 1 is due at the beginning of lecture next Tuesday (January 30). • You may work together on the problems, but: • We strongly recommend working on the problems by yourself first. • Your answers must be handwritten and in your own words. • You must list other students you worked with at the start of your answers.
Announcements • Optional problem set work session: Thursday, 4-6 p.m. in 648 Evans Hall.
Components of a Good Problem Set Answer • Neatness is important. • Graph is usually essential. • Explain your answer; give the reasoning or intuition for why something happens.
I. I NTRODUCTION TO M ARKETS
Two Building Blocks • Scarcity: A situation in which a person, firm, or country faces a constraint. • Gains from Specialization: A group of people can produce and consume more if they specialize and trade than if each is self-sufficient.
Market • An arrangement by which economic exchanges between people take place.
II. S UPPLY AND D EMAND
Demand • The buying side of the market. • There is a negative relationship between the quantity demanded of a good and its price. • The relationship reflects optimizing behavior on the part of households.
Demand Curve for Blueberries Price (P) D Quantity (Q)
Supply • The selling side of the market. • There is a positive relationship between the quantity supplied of a good and its price. • This relationship reflects optimizing behavior on the part of firms.
Supply Curve of Blueberries P S Q
III. M ARKET E QUILIBRIUM
Equilibrium in the Market for Blueberries P S 1 P 1 Equilibrium • D 1 Q Q 1
What happens if the price is below P 1 ? P S 1 P 1 • P too low D 1 Q Q S Q 1 Q D Excess Demand (Shortage)
What happens if the price is above P 1 ? P S 1 P too high P 1 • D 1 Q Q D Q 1 Q S Excess Supply (Surplus)
How Do Markets Deal with Scarcity and the Gains from Specialization? The existence of markets allows people to specialize along • the lines of comparative advantage because they can trade for other goods that they want. Markets deal with scarcity by balancing the optimizing • behavior of consumers and producers. Prices adjust to equilibrate the two sides of the market. The consumers who actually get the good are those who • are willing and able to pay the equilibrium price. The firms that actually produce the good are those that find • it profit-maximizing to produce at the equilibrium price.
IV. S HIFTS IN THE C URVES
Ceteris Paribus • “other things being equal” • All variables other than those being studied are assumed to be constant.
Market for Blueberries A More Costly Technology P S 2 S 1 P 2 P 1 D 1 Q 1 Q Q 2
Movements Along vs. Shifts • A change in the quantity supplied or quantity demanded because the price changed: Movement along the curve. • A change in the quantity supplied or quantity demanded at the same price: Shift of the curve.
Market for Blueberries Adverse Change in Tastes P S 1 P 1 P 2 D 2 D 1 Q Q 2 Q 1
V. E FFECTS OF A P RICE C ONTROL
Price Control • Government sets the price of a good; it is not allowed to go to its equilibrium level. • Price Ceiling: Maximum price; price is held below its equilibrium level. • Price Floor: Minimum price; price is held above its equilibrium level.
Bottled Water after a Disaster P S 1 P 2 P 1 D 2 D 1 Q 1 Q Q 2
Bottled Water after a Disaster with a Price Ceiling P S 1 P (P 1 ) D 2 D 1 Q S Q Q D Shortage
Effects of a Price Ceiling • Will lead to a shortage. • Good will have to be allocated in some way other than by price. • Discourages the decrease in quantity demanded and increase in quantity supplied that automatically occur as the price rises.
Why does California produce some water- intensive crops? • Part of the answer is that much of our irrigation water is provided at a controlled price that is below the equilibrium level. • As a result, there is a shortage of water. • Water must be allocated by means other than price, and so some farmers do not feel the full opportunity cost of the water they use.
Recommend
More recommend