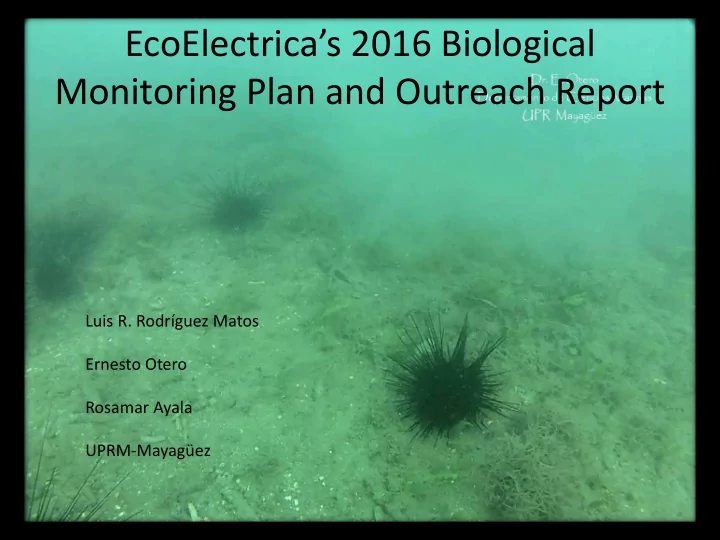

EcoElectrica’s 2016 Biological Monitoring Plan and Outreach Report Luis R. Rodríguez Matos Ernesto Otero Rosamar Ayala UPRM-Mayagüez
Summary Monthly Water Quality Sampling Continuous Water Quality Monitoring (YSI Sondes) Impingement Sedimentation Seagrass Habitat Mapping Fosforescent Bay Monitoring
Water Quality • Monthly sampling of temperature, salinity, turbidity, phytoplankton and cyanobacterial biomass indicators (chlorophyll and phycoerythrin), and colored organic matter fluorescence. • Continuous Monitoring of pH, turbidity, salinity, DO, temperature.
Study Area Water Quality Stations at Guayanilla Bay .
Turbidity Time Series 16 15 14 13 12 11 Estacion 11 10 Turbidity (NTU) Estacion 12 9 Estacion 4 8 Estacion 4N 7 6 Estacion 5 5 Estacion 8 4 Estacion Intake 3 Estacion Outfall 2 1 0
Temperature Time Series 32.5 31.5 Estacion 11 Temperature °C 30.5 Estacion 12 Estacion 4 29.5 Estacion 4N Estacion 5 28.5 Estacion 8 Estacion Intake 27.5 Estacion Outfall 26.5
Chlorophyll Time series 4.8 4.4 4 3.6 Estacion 11 Chlorophyll (ug/l ) 3.2 Estacion 12 2.8 Estacion 4 2.4 Estacion 4N 2 Estacion 5 1.6 Estacion 8 1.2 Estacion Intake 0.8 Estacion Outfall 0.4 0
Phycoerythrin Time Series 360 310 Estacion 11 Phycoerythrin (RFU ) Estacion 12 260 Estacion 4 Estacion 4N 210 Estacion 5 Estacion 8 160 Estacion Intake Estacion Outfall 110 60
Salinity Time Series 37 36 35 Outfall SALINITY 34 Intake 12 4N 33 32 31 Jan Feb Mar Apr May Jun Jul Aug Sep Oct Nov
YSI Sonde at the Intake. Data collected every 3 min for 14 days intervals
Continuous Monitoring at Intake and Outfall (YSI Sondes) Average Dissolve Oxygen 8.5 8 7.5 Dissilve Oxygen (ul/L) 7 6.5 6 5.5 5 4.5 4 Outfall Intake
Continuous Monitoring at Intake and Outfall (YSI Sondes) Average Turbidity 1000 100 Turbidity (NTU) 10 1 Outfall Intake
Impingement
Impingement Impingement Day Time Survey 2015 140 120 100 Number of Individual 80 60 40 20 0 January February March April June July August October November December Sampling Month Atlantic bumper Atlantic Spadefish Atlantic Surgeonfish Black Margate Blue Head Wrasse Blue Tang Dog Snapper Foureye Butterflyfish Grey Snapper Horse-Eye Jack Ocean Surgeonfish Porkfish Queen Angelfish Sargent major School master Snapper Surgeon Fish Tarpoon Yellow tail Snapper
Impingement Impingement Night Time Survey 2015 140 120 100 Number of Individual 80 60 40 20 0 January February March April June July August October November December Sampling Month Atlantic bumper Atlantic Spadefish Atlantic Surgeonfish Black Margate Blue Head Wrasse Blue Tang Dog Snapper Foureye butterfly fish Grey Snapper Horse-Eye Jack Ocean Surgeonfish Porkfish Queen Angelfish Sargent major School master Snapper Surgeon Fish Tarpoon Yellow tailsnapper
Sedimentation 350 289 300 265 235 232 250 225 204 223 209 205 199 178 158 182 200 148 152 140 150 107 98 97 97 95 93 92 91 100 82 77 75 54 46 50 34 28 25 0 4-Apr-14 7-Apr-14 2-May-14 5-May-14 5-Dec-14 15-Apr-15 22-Aug-16 15-Sep-16 4N EAST INTAKE OUTFALL WEST
Seagrass Mapping Benthic photographs were taken along 50 m long transects, 12-15 m apart from each other and oriented perpendicularly to the pier. Photographs were taken using a surface deployed quadrat and camera array in navigable waters. Photographs were taken while snorkeling when precise navigation was not possible due currents, depth or unsafe navigation conditions were present (i.e. too shallow). Photographs were geotagged by synchronizing GPS coordinates collected during sampling and a specialized geotagging software (RoboGeo). Seagrass Cover was estimated at each site using Coral Point Counter software (CPCe). Seagrass cover countoures were created using Grapher (Golden Software)
Seagrass Mapping
Seagrass Mapping
Seagrass Mapping
Seagrass Mapping
Seagrass Mapping
Seagrass Mapping
Seagrass Mapping
Seagrass Mapping
Seagrass Mapping
Seagrass Mapping
Seagrass Mapping
Seagrass Mapping
Outreach: Fosforescent Bay
Chlorophyll Time Series at Fosforescent Bay 1600 1400 1200 Station 1 1000 Station 2 Station 3 800 Station 4 Station 5 600 Station 6 Station 7 400 200 0 29-Jul 18-Aug 7-Sep 27-Sep 17-Oct 6-Nov 26-Nov
Bioluminescence Levels Bahía Fosforescente 2.50E+12 2.00E+12 Estacion 1 1.50E+12 Estación 2 Estación 3 Estacion 4 1.00E+12 Estación 5 Estación 6 5.00E+11 0.00E+00 29-Jul 18-Aug 7-Sep 27-Sep 17-Oct 6-Nov 26-Nov 16-Dec 5-Jan
Pyrodinium bahamense abundance 12000 10000 8000 Estacion 1 Estación 2 6000 Estación 3 Estacion 4 Estación 5 4000 Estación 6 2000 0 29-Jul 18-Aug 7-Sep 27-Sep 17-Oct 6-Nov 26-Nov 16-Dec 5-Jan
Future • Impingement An extension to corroborate seasonality with better intervalometers and light sources.
Sedimentation Results from trace element (i.e. Cu, As, Pb) contents of sediments from traps. Samples were sent and analytical results are expected to arrive during January 2017. Evaluate the possibility of trace element transport along suspended sediments in Guayanilla Bay.
Seagrasses Complete sampling and analysis of seagrass distribution close to EcoElectricas pier at un- sampled sites. Evaluate the temporal distribution of seagrasses at sites close to the Outfall Station.
Water Quality Continuous Analysis of Water Quality at the Intake and Outfall Sites Monthly sampling of other sites. Intercalibration between sampling strategies. Intercomparison with previous studies.
Fosforescent Bay Expand monitoring to include determinations of the appearance of subsurface oxygen depletion that may affect the production of bioluminescence Evaluate alternative means of bioluminescence determination using economic photographic approaches. These may be suitable to expand stakeholders monitoring.
Recommend
More recommend