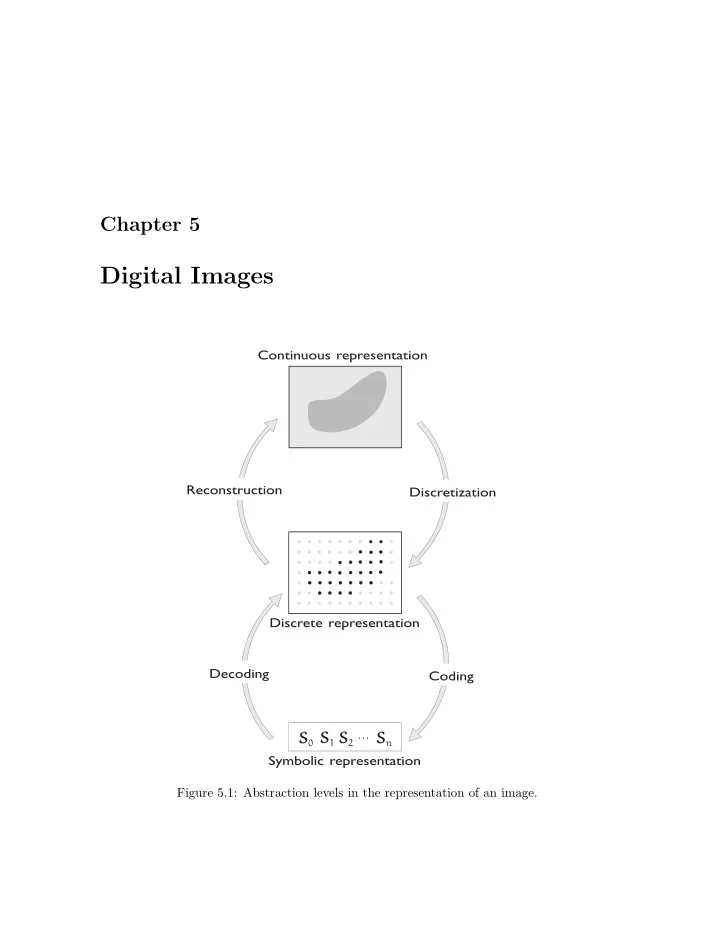

Chapter 5 Digital Images Figure 5.1: Abstraction levels in the representation of an image.
2 CHAPTER 5. DIGITAL IMAGES Figure 5.2: A halftone and the graph of its image function. Figure 5.3: A uniform lattice gives rise to a matrix representation for the image.
3 Figure 5.4: The same image sampled at different spatial resolutions. Figure 5.5: Graphs associated to the matrix representation.
4 CHAPTER 5. DIGITAL IMAGES Figure 5.6: The 4-connected neighborhood (a) and 8-connected neighborhood (b) of a pixel. Figure 5.7: A curve that is 8-connected but not 4-connected. Figure 5.8: A pixel lattice (a), the corresponding mesh (b), and the dual lattice (c).
5 Figure 5.9: Nonorthogonal, regular lattice of the plane. Figure 5.10: Shape of a pixel in a nonorthogonal lattice. Figure 5.11: (a) Hexagonal discretization. (b) Neighborhood of a pixel in the hexagonal discretization.
6 CHAPTER 5. DIGITAL IMAGES Figure 5.12: (a) 8-bits quantization (b) 1-bit quantization. Figure 5.13: Quantization levels and the graph of the quantization function.
7 Figure 5.14: Two-dimensional quantization cells. Figure 5.15: Quantization contours under different numbers of quantization levels: (a) 256; (b) 16; (c) 8; (d) 2.
8 CHAPTER 5. DIGITAL IMAGES Figure 5.16: Mach bands. Figure 5.17: Histogram of a grayscale image.
9 Figure 5.18: Cells in two-dimensional uniform quantization. Figure 5.19: Color map of an image.
10 CHAPTER 5. DIGITAL IMAGES Figure 5.20: Digital color image quantized at 24 bits. See Plate 3 in color insert. Figure 5.21: Uniform quantization at eight bits (left) and four bits (right). See Plate 4 in color insert.
11 Figure 5.22: Populosity algorithm: result of quantization at eight bits (left) and four bits (right). See Plate 5 in color insert. Figure 5.23: Adaptive quantization. (a) Original histogram. (b) Equalized histogram.
12 CHAPTER 5. DIGITAL IMAGES Figure 5.24: (a), (b), (c): Applying the median cut algorithm. (d) Quantization levels ob- tained. Figure 5.25: Median cut algorithm: result of quantization at eight bits (left) and four bits (right). See Plate 6 in color insert.
13 Figure 5.26: Graph of the entropy of two-symbol alphabet encoding. Figure 5.27: Piecewise linear approximation of an image.
14 CHAPTER 5. DIGITAL IMAGES Figure 5.28: Compression by transformation of the model.
Recommend
More recommend