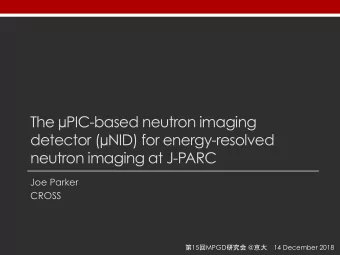
Development of a counting-type neutron imaging detector for energy- - PowerPoint PPT Presentation
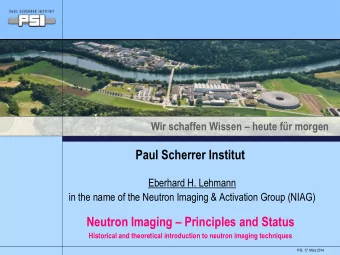
Development of a counting-type neutron imaging detector for energy- resolved imaging at J-PARC/MLF Joe Parker CROSS-Tokai BL22 Group 1 J-PARC 13 October 2016 RADEN/BL22 and NID development members
Development of a counting-type neutron imaging detector for energy- resolved imaging at J-PARC/MLF � Joe Parker CROSS-Tokai BL22 Group � 1��������� J-PARC � 13 October 2016 �
RADEN/BL22 and µ NID development members � JAEA/J-PARC Center Takenao Shinohara Tetsuya Kai Kenichi Oikawa (BL10) Masahide Harada (BL10) Takeshi Nakatani Mariko Segawa Kosuke Hiroi Yuhua Su CROSS-Tokai Hirotoshi Hayashida Joe Parker ( µ NID Lead Developer) Yoshihiro Matsumoto Shuoyuan Zhang Nagoya University Yoshiaki Kiyanagi �
RADEN/BL22 – Neutron imaging instrument at the MLF � World’s first instrument dedicated to energy-resolved neutron imaging using pulsed neutrons! � • World-class, pioneering instrument for pulsed-neutron imaging • Leading facility for conventional radiography in Japan • Commissioning from Nov. 2014, user program from April 2015 � First images from RADEN (7 Nov 2014) �
Energy-resolved neutron imaging � • Energy-dependence � Energy-dependent neutron quantitative information on transmission � macroscopic distribution of microscopic quantities Resonance absorption • Pulsed neutrons � wide energy range, accurate energy determination by Bragg-edge, Magnetic imaging time-of-flight • Requires detectors with: • Spatial resolution < 1 mm • Time resolution < 1 µ s �� meV � Energy � 1 keV � • Count rate > 1 Mcps 10 �� Wavelength � 10 -2 �� • Strong background rejection �
RADEN/BL22 – Neutron imaging instrument at the MLF � Experimental Space � 13m � Medium sample stage � Bulk shield � Optical bench � 5m � 1 st Detector Moderator � Optical Devices position � Large load Shutter � 2 nd Detector sample stage � position � 0m � 8m � 14m � 18m � 23m � 27m � 31m � Properties of RADEN � Conventional radiography/pulsed-neutron Large beam size (up to 30x30 cm 2 ) � imaging � High flux (2.6x10 7 n/s/cm 2 @ <0.5eV) � Variable L/D (up to 7500) � Wide bandwidth (~9 � , �� / � < 0.2%) � Large experimental area �
RADEN computer system � • Computer control of beam line components, sample stages, and detectors using IROHA2 (automated measurements) • Large data storage capacity (24TB SSD primary, 100TB secondary) • Fibre channel network (8 Gb/s) for fast data transfer • GPGPU cluster (12 CPUs, 24 GPGPUs) for data analysis �
Detectors available at RADEN � Camera type Counting type nGEM Andor iKon-L - Micro-pattern w/ 10 B (10% eff.) - FOV: 10 × 10 cm 2 - Cooled CCD - � x=1mm , � t=15ns, < 1 Mcps - 300 µ m - No TOF - Automated system for CT LiTA12 - Li-glass scint. (40% eff.) - FOV: 5 × 5 cm 2 - � x=3mm , � t=40ns,6 Mcps Neutron Color I.I. µ NID - High-resolution - Micro-pattern (200 µ m) - 3 He (18% eff.) - High-speed (10k, - FOV: 10 × 10 cm 2 30k, 100k fps) - � x=0.3mm , � t=0.6 µ s, < 1 Mcps
Current performance of counting- type detectors at RADEN � 100 Count rate (Mcps) � 10 LiTA12 1 nGEM µNID 0.1 0.01 0.1 1 10 Spatial resolution (mm) �
µ PIC-based Neutron Imaging Detector ( µ NID) �
µ PIC-based neutron imaging detector ( µ NID) � Neutron detection via 3 He � • 3-dimensional tracking of decay pattern neutron 3 He proton Track length • Energy via time-over-threshold ~8 mm in gas (TOT) triton • Compact ASIC+FPGA data encoder → Good spatial resolution, 9.0 cm strong background rejection, E � high data rates possible � Digital encoder with time-over-threshold (TOT) 32.8 cm µ PIC � TOT for proton-triton track Energy Deposition µ PIC � Threshold � 30 Time-above-threshold (clocks) Neutron Proton 25 Triton 20 Discriminator � 15 400 µ m 10 5 Time-above-threshold 0 0 10 20 30 40 50 60 X (strips) ( ∝ energy dep.) �
µ PIC-based neutron imaging detector ( µ NID) � Encoders � Ethernet � DAQ PC � Add 10GbE hub to reduce External SiTCP � cables � timing GbE × 4 � signals � µ PIC � Encoders � Control box �� DAQ controller ±2.5V, +3.3V � �� system Sensor power � monitor �� DC power Vessel pressure � • FPGA-based data encoders Ambient temperature � • FPGA-based DAQ controller • Data transfer via Ethernet � Network � Monitoring � DAQ control � Power �
µ NID performance � • Strong gamma rejection Measured TOT distribution using TOT information Time-over-threshold (ns) 250 • Template fit for position 200 Triton Proton analysis 150 100 Template 50 for fit 0 -2 0 2 4 6 8 Distance from interaction point (mm) µ NID performance characteristics � Area � 10 x 10 cm 2 � Image data taken at NOBORU in Feb. 2011 Counts/hr/3.75 clocks Spatial res. � 0.3 mm � 137 Cs 7 Neutrons No source 6 Time res. � 0.6 µ s � 5 γ ’s 4 � TOF/TOF � < 0.07% @18m � ‘Energy’ 3 � -sensitivity � < 10 -12 � cut 2 1 Efficiency � Up to 26% � 0 0 100 200 300 400 500 Avg. time (clocks) Total TOT (clocks) � Count rate � 0.6 Mcps �
Development of µ NID � • Objectives: • Improve count rate and spatial resolution • Improve data analysis; reduce processing time • Integration into RADEN control system • Count rate • Throughput of data encoder modules • Drift velocity, stopping power of filling gas • Readout geometry • Spatial resolution • Electron diffusion, stopping power of filling gas • Readout strip pitch • Improvement of count rate and data analysis is most pressing
Data encoder � • FPGA-based encoder modules • CMOS ASICS CMOS ASICS • Spartan6 FPGA • Ethernet transfer (SiTCP) 22 cm • 128 ch/encoder (4 encoders total) FPGA • Original encoder throughput limited memory DDR3 by 100BASE-T Ethernet transfer • Upgrades GbE � • Gigabit Ethernet PHY (1 st revision) • On-board DDR3 memory (2 nd revision, not yet tested) Originally developed by Kyoto U. and KEK (Open-it) �
Gas optimization � • Change to CF 4 -based mixture • Increased drift velocity (count rate) • Decreased electron diffusion (spatial resolution) • Increased stopping power (both) Previous gas � New gas � Mixture � Ar-C 2 H 6 - 3 He CF 4 -iC 4 H 10 - 3 He (67:7:30 @ 2atm) � (45:5:50 @ 2atm) � Drift velocity � 23 µ m/ns � 58 µ m/ns � Diffusion � 275 µ m/cm 1/2 � 80 µ m/cm 1/2 � Efficiency @25.3meV � 18% � 26% � Proton-triton track length � 8 mm � 5 mm � Gas characteristics simulated with MAGBOLTZ, GEANT4 �
Rate testing at RADEN � • Control incident intensity using B 4 C slits Detector � • Testing of • rate capacity of hardware B 4 C slits � • rate linearity of detector � N e u t r o n b e a m �
Rate testing at RADEN � • Test of revised encoders Neutron rates vs slit area � with GbE 5 • Ar-Ethane gas mixture Count rate (Mcps) � 4 • Compared with original encoder 3 • Rate capacity GbE 2 increased by more 100Mbps than factor of 6 1 • Mostly linear up to more 0 than 3 Mcps � 0 500 1000 1500 2000 2500 Slit area (mm2) �
Rate testing at RADEN � • Test of CF 4 -based gas Neutron rates vs slit area � mixture 10 • Encoders with GbE 8 Count rate (Mcps) � • Rate capacity over 8 Mcps 6 • Nearly factor of 2 Ar-C2H6 4 increase over Ar-based CF4-iC4H10 gas mixture 2 0 0 1000 2000 3000 4000 Slit area (mm2) �
Spatial resolution with CF 4 � • Image of Gd test pattern 8 cm � • L/D: 5000 • Exposure time: 1.5 hours • 16% contrast at 2.5 lp/mm (200 µ m line width) • Improvement over Ar- Ethane mixture � 0.6 mm � 0.5 mm � 0.4 mm � 0.3 mm � 0.2 mm � Transmission � 0.95 0.9 0.85 0.8 0.75 0.7 0.65 0.6 Bin size: 40 x 40 µ m 2 � 0.55 50 60 70 Distance from top (mm) �
Remaining issues � • Data analysis: performance Neutron reconstruction efficiency of event clustering 1 Efficiency • Event ‘pile-up’ at rates 0.8 above 100~300 kcps <0.4 Mcps � 0.6 2.5 Mcps � • Developing new algorithm 5.6 Mcps � • Working with software 0.4 company to improve speed and ease-of-use of analysis 0.2 software � 0 0 5 10 15 20 25 30 35 40 TOF (ms) Efficiency of analysis determined by comparing numbers of raw hits and reconstructed neutron events �
Other ongoing development � • New µ PIC readout geometry • Additional strip plane at 45° to x,y strips • Aid in reconstruction of y2 � simultaneous events y1 � • Now testing at Kyoto U. u2 � • Reduced strip pitch u1 � x2 � x1 � • Manufactured using MEMS 215 µ m � (structures down to 10 µ m) 280 µ m � • µ PIC with 280, 215 µ m pitches • Performed preliminary testing at RADEN
First on-beam test of MEMS µ PIC at RADEN � Neutron TOF (MEMS uPIC test) s µ Counts/pulse/25 0.12 0.1 0.08 280 µ m pitch (192 × 192 strips) � 0.06 0.04 0.02 0 0 5 10 15 20 25 30 35 40 Time (ms) Neutron TOF spectrum measured on 215 µ m section � 215 µ m pitch (64 × 64 strips) � • No signal measured on 280 µ m section (gain too low) • Signal confirmed on 215 µ m section MEMS µ PIC test board � • Further testing to study gain stability, imaging capability
µ NID with Boron converter �
Recommend
More recommend
Explore More Topics
Stay informed with curated content and fresh updates.
![TDR Assumptions for Pulsed Neutron Yield [/keV] Neutron Yield [/keV] 2500 2000 2000 2500](https://c.sambuz.com/892356/tdr-assumptions-for-pulsed-s.webp)
