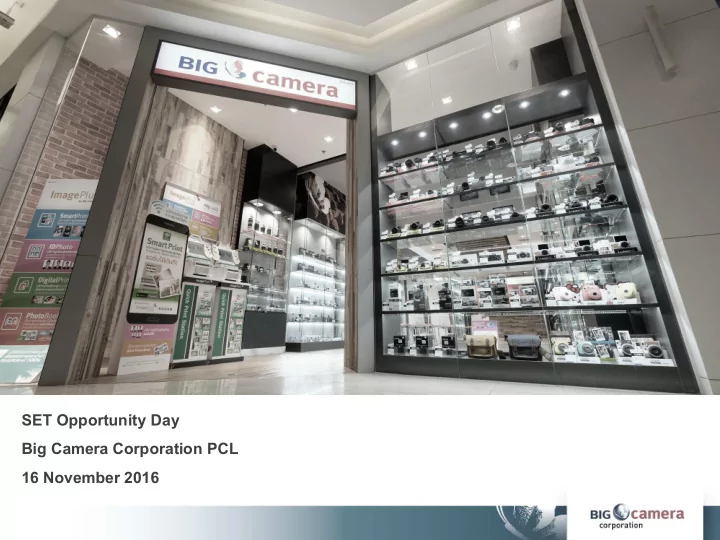

SET Opportunity Day Big Camera Corporation PCL 16 November 2016
Disclaimer This presentation may contain forward looking statements by the management of Big Camera Public Company Limited (“BIG”) . Forward looking information is based on management’s current views and assumptions including, but not limited to, prevailing economic and market conditions. Such forward looking statements are not guarantees of future performance and involve risks and uncertainties, and actual results may differ from those in the forward looking statements as a result of various factors and circumstances. The views, analyses and opinions expressed herein contain some information derived from publicly available sources and third party information providers. No representation or warranty is made as to the accuracy, completeness, or reliability of such information.
Agenda Market Situation
Market Situation Camera’s main components Lens Unit CCD Unit
Market Situation Earthquake in Kumamoto disrupted camera productions Sony is a major producer of image sensor supplying to other camera manufacturers . Earthquake in Kumamoto, Japan, on April 2016 had disrupted Sony’s production of image sensor unit used in digital cameras and iphone7. Supply of components used in digital camera’s production were shortage. Sony took around 6 months to recover their production of image sensor. Supply of some current models started to be shortage from end of 2 nd Q. All new models of digital camera were delayed due to this problem. Full recovery in 4 th Quarter.
Market Overview New cycle of product line up New cameras were launched in “ Photokina 2016”, a world exhibition in Germany. Big cycle of new model change from all camera brands in the past 2 years . New 15 cameras, 6 action cameras, 22 lenses plus additional new flagship models in 1 st Q 2017 started to sell in Thailand from now. Demand on current models slowed down during the end of 3 rd Q after the new products had announced. Supply of new products were delayed due to the earthquake problem. Average selling price of new models increases by 20% to 25%.
Market Situation Mirror- less Camera’s Growth 191.7% 161.0% 173.7% 133.3% 146.1% 134.9% 123.1% 110.0% 95.2% 87.6% 198.2% 165.9% 170.7% 76.1% 71.1% 131.9% 141.5% 124.0% 115.0% 107.9%111.6% 109.8% 84.5% 87.5% Value Unit Data Source: GFK Data
Agenda Strategy
Strategy Digital Camera Mobile Phone Printing
Strategy Distribution Channel “The best location nationwide” – Our 250 shops are located on the prime area with the best location in the shopping mall. Big Camera Shop 220 branches + 10 branches in 2016 - Wonder Photo Shop 5 branches in 1 st Q/17 - Big Mobile Shop 25 branches + 2 branches in 2016 - - AIS Shop
Agenda 3Q Performance
3Q Performance Total Revenue Revenue breakdown +42% +30% yoy 1.62 +1% yoy 1.40 1.29 1.19 yoy Others Service 1.18 10% 1.14 4% 0.98 0.98 Mobile 0.82 0.69 0.80 Phone 4% Camera & Accessories Q114 Q214 Q314 Q414 Q115 Q215 Q315 Q415 Q116 Q216 Q316 92% THB billion 3Q/16 9-months revenue increased by THB 727 mil or 23% y-y mainly from high demand on high-end camera category.
3Q Performance Gross Profit Gross Profit Margin 21.61% 23.38% 22.67% GPM 20.32% 19.33% 17.36% 18.34% 22.87% 25% 20% 17.38% 247 260 266 265 15% 183 10% 169 179 5% 0% Q3/15 Q3/16 THB Mil Q115 Q215 Q315 Q415 Q116 Q216 Q316 Gross Profit (GP) increased by THB 68 mil y-y, from THB 179 mil in Q3/15 to THB 247 mil in Q3/16. Gross Profit Margin (GPM) increased from 17.36% in Q3/15 to 22.67% in Q3/16. Y2015 Average GPM is 18.81%.
3Q Performance Net Profit Net Profit Margin 16.8% 14.4% 14.1% 15% 12.3% Net Profit Margin 10.6% 9.9% 234.2 9.4% 7.4% 10% 7.2% 198.9 185.7 5% 125.7 116.9 70.8 73.0 0% Y2015 9-Months THB Mil Q115 Q215 Q315 Q415 Q116 Q216 Q316 Net Profit (NP) increased from THB 117 mil in Q3/15 to THB 126 mil in Q3/16. Net Profit Margin (NPM) increased from 9.44% in Y2015 to 14.1% for 9-months of 2016. * Q1/2016 included THB 27 mil from tax loss carry forward and THB 19 mil gain from business transfer.
3Q Performance SG&A SG&A 17.06% 12.95% 13.47%14.59% 16.02% 15.17% 250 20% 18.33% 16.02% 200 15.17% 15% 150 10% 100 180 212 188 168 174 191 5% 50 186 - 0% THB Mil 1Q15 2Q15 3Q15 4Q15 1Q16 2Q16 3Q16 Q3/15 Q3/16 Selling & Administrative Expenses increased by THB 11 mil y-y, mainly from an increases in shop rental fee from shop expansions, sales commission expenses, and promotional expenses. Approximately 75% of SG&A were shop rental fee and staff salary. In terms of percentage of revenue, SG&A expenses slightly increased from 15.17% in Q3/15 to 16.02% in Q3/16.
Thank you
Recommend
More recommend