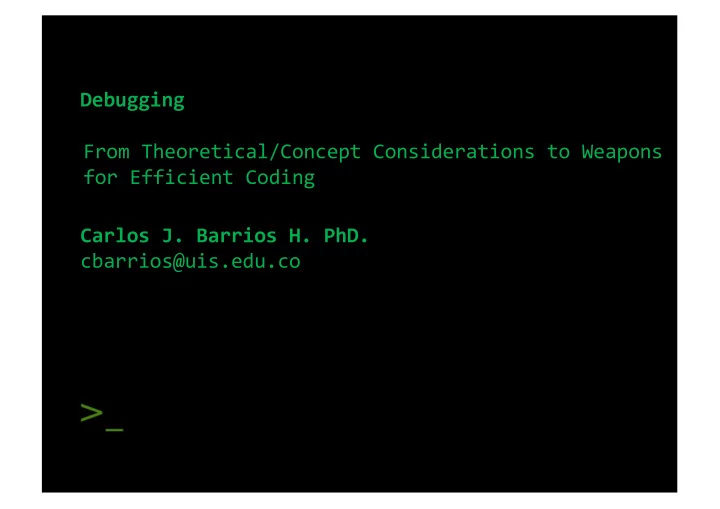
Debugging From Theoretical/Concept Considerations to Weapons for - PowerPoint PPT Presentation
Debugging From Theoretical/Concept Considerations to Weapons for Efficient Coding Carlos J. Barrios H. PhD. cbarrios@uis.edu.co Sources of This Presentation: Guest lecture DR. R o b e r t O a t e s Icos R esearch Group University o f
Debugging From Theoretical/Concept Considerations to Weapons for Efficient Coding Carlos J. Barrios H. PhD. cbarrios@uis.edu.co
Sources of This Presentation: Guest lecture DR. R o b e r t O a t e s Icos R esearch Group University o f Nottin g h a m (http://www.cs.nott.ac.uk/~pszjg1/FSE12/FSE_9.pdf) SC_CAMP Debbuing and Prolifing Lectures DR. Xavier Besseron University of Luxembourg (https://wwww.sc-camp.org)
Why Debug Software? • � It’s an important work skill • You ‘re becoming professionals! � • It’s an important development skill � • It’s an important life skill � • You’ re not perfect (and perfect is not good)
General Purpose Debugging 6 Understanding 1. Reproduction and Data Gathering 2. Hypothesis 3. Experiment Design 4. Test 5. Implementation 6. Design 1. 2. Implement 3. Test
General Purpose Debugging Understanding the System � � Look at the system specifications if available � Inputs � � Outputs � � How do the components of the system fit together? � Information Flow � Output backwards � � Input forwards �
General Purpose Debugging Reproduction and Data Gathering � A hugely important part of debugging � Simple if bug is persistent � � Hard if the bug is transient � � Opportunity to study the system when the bug is � occurring
General Purpose Debugging � � Questions to ask � What state was the system in? � Operating system ÷ � Program Settings ÷ � � When does the bug happen? � � When the system was first turned on ÷ � After years of use ÷ � When OK is clicked ÷ � The program settings in particular will rule out huge swathes of code! Remember: A Machine makes what do you want and order (or the architect orders!)
General Purpose Debugging Hypothesis � A hypothesis is an explanation which explains the observed behaviour of the bug IN CONTEXT � i.e. Knowing how the system works! � � Sometimes a hypothesis will only explain some of the behaviour � There may be multiple bugs manifesting at the same � time!
General Purpose Debugging Experiment Design � Design an experiment which will falsify your hypothesis � If you can falsify it then it is an incorrect hypothesis � If you can’t then it MIGHT be the source of the problem
General Purpose Debugging Test � If your test fails to falsify your hypothesis � Move on to step 6, implementation � � If your test falsifies your hypothesis � Move to step 3 (hypothesis) � OR � Move to step 1 (system understanding) � � Regardless, this test has given you more information about the nature of the bug Remember: It is important design your workflow/roadmap of your system/implementation
General Purpose Debugging Implementation � Sometimes this makes up part of the Hypothesis and Test phases � “If I ‘fix’ it and the problem goes away, then the � hypothesis isn’t falsified” � Undefined scenarios � If the bug happens because a customer is using the software � in a way you hadn’t predicted � Requires a whole new design cycle ÷
Software Debugging � � Traces � Screen � � Log � � Breakpoints � Code execution � � Watches � � Memory � inspection
Software Debugging Traces � � Traces are streams of data taken from the system � On-screen � � Log File � � Uses � Embedded systems with no direct connection � � Any system producing large volumes of data �
Now, Debugging in Practice www.sc-camp.org
IntroductionTools for DebuggingCommon bugsGood practices to catch bugs Know Your Bugs: Weapons for Efficient Debugging Xavier Besseron SuperComputing Summer Camp Xavier Besseron Know Your Bugs: Weapons for Efficient Debugging 16 / 36
IntroductionTools for DebuggingCommon bugsGood practices to catch bugs Why debugging? Bugs are in every programs • Industry Average: 1 " about 15 - 50 errors per 1000 lines of delivered code " Bugs in High Performance Computing • Even more difficult due to concurrency • Can crash super-computers • Can waste large amount of CPU-time Famous bugs and consequences • Ariane 5 rocket destoryed in 1996: 1 billion US $ • Power blackout in US in 2003: 45 million people affected • Medtronic heart device vulnerable to remote attack in 2008 • ... 1 Code Complete by Steve McConnell Xavier Besseron Know Your Bugs: Weapons for Efficient Debugging 17 / 36
IntroductionTools for DebuggingCommon bugsGood practices to catch bugs Outline Tools for Debugging 2 Compilers GNU Debugger Valgrind Xavier Besseron Know Your Bugs: Weapons for Efficient Debugging 18 / 36
IntroductionTools for DebuggingCommon bugsGood practices to catch bugs Tools for debugging Compilers • It’s the first program to check your code • GCC,Intel Compiler,CLang, MS Compiler, ... Static code analyzers • Check the program without executing it • Splint, Cppcheck, Coccinelle, ... Debuggers • Inspect/modify a program during its execution • GDB: the GNU Project Debuggerfor serial and multi-thread programs • Parallel debuggers (commercial): RogueWave Totalview, Allinea DDT Dynamics code analyzers and profilers • Check the program while executing it • Valgrind, Gcov, Gprof, ... • Commercial software: Purify, Intel Parallel Inspector, .. Xavier Besseron Know Your Bugs: Weapons for Efficient Debugging 19 / 36
IntroductionTools for DebuggingCommon bugsGood practices to catch bugs Compilers 1/2 What does a compiler do? • Translate source code to machine code • 3 phases: • Lexical analysis: recognize "words" or tokens • Syntax analysis: build syntax tree according to language grammar • Semantic analysis: check rules of the language, variable declaration, types, etc. • With this knowledge, a compiler can find many bugs → Pay attention to compilerwarningsanderrorsof a program A compiler can find out if your program makes sense according to the language. However, it cannot guess what you are trying to do. Xavier Besseron Know Your Bugs: Weapons for Efficient Debugging 20 / 36
IntroductionTools for DebuggingCommon bugsGood practices to catch bugs Compilers 2/2 How to use the compiler • Choose your compiler GCC CLang Intel Compiler clang icc C gcc clang++ icpc C++ g++ ifort Fortran gfortran • Activate warning messages with the -Wall parameters • Warnings can be enabled/disabled individually, cf documentation • Compile with debug symbols with -g parameters Example $ gcc -g -Wall program.c -o program program.c: In function ’main’: program.c:4:15:error: ’y’ undeclared (first use in this function) int z = x + y; ^ program.c:4:15: note: each undeclared identifier is reported only once for each program.c:4:7:warning: unused variable ’z’ [-Wunused-variable] int z = x + y; ^ Xavier Besseron Know Your Bugs: Weapons for Efficient Debugging 21 / 36
IntroductionTools for DebuggingCommon bugsGood practices to catch bugs GNU Debugger 1/2 GDB is the GNU Debugger • Allow to execute a program step by step • Watch the value of variables • Stop the execution on given condition • Show the backtrace of an error • Modify value of variables at runtime Starting GDB • Compile your program with the -g option • Start program execution with GDB gdb --args myprogram arg1 arg2 • Or open a core file (generated after a crash) gdb myprogram corefile Xavier Besseron Know Your Bugs: Weapons for Efficient Debugging 22 / 36
IntroductionTools for DebuggingCommon bugsGood practices to catch bugs GNU Debugger 2/2 Using GDB • Command line tool • Many graphical frontends available too:DDD,Qt Creator, ... • Online documentation & tutorial: http://sourceware.org/gdb/current/onlinedocs/gdb/ http://www.cs.swarthmore.edu/~newhall/unixhelp/howto_gdb.html Main commands • help <command> : get help about a command • run : start execution • continue : resume execute • next : execute the next line • break : set a breakpoint at a given line or function • bracktrace : show the backtrace • print : print the value of a variable • quit : quit GDB Xavier Besseron Know Your Bugs: Weapons for Efficient Debugging 23 / 36
IntroductionTools for DebuggingCommon bugsGood practices to catch bugs Valgrind 1/2 Valgrind is a dynamic analysis tool • Execute your program with dynamic checking tool: Memcheck,Callgrind, Helgrind, etc. Memcheck: memory error detector • Enable with -tool=memcheck (by default) • Check for memory-related errors: unitialized values, out of bound access, stack overflow, memory leak, etc. • For memory leaks, add option -leak-check=full • http://valgrind.org/docs/manual/mc-manual.html Callgrind: performance profiler • Enable with -tool=callgrind • Check the time you spend in each function of your code • Visualize results withKCachegrind • http://valgrind.org/docs/manual/cl-manual.html Xavier Besseron Know Your Bugs: Weapons for Efficient Debugging 9 /36
Recommend
More recommend
Explore More Topics
Stay informed with curated content and fresh updates.
