
Create Presentation Reports for Microsoft Project Transform your Microsoft Project schedules into presentation reports with Milestones Professional. KIDASA Software ’ s Milestones Professional offers a direct interface to Microsoft Project, making it easy to generate presentation report formats beyond the standard formats offered by Microsoft Project. In the following pages, you ’ ll learn how to: Use the Project to Milestones Wizard to create presenta- Create tion reports for Microsoft Project, choosing from more than 70 built - in presentation formats. Customize Is one of the 70+ formats almost perfect? Customize it, make it perfect and add it to your Milestones Project Wizard as a custom project template. Do you have a unique presentation format? Design and Build it Your Way Way build it “ from scratch ”; tag milestone symbols, and columns to let Milestones know what information you want to bring in from Microsoft Project. Keep all of your presentation schedules up - to - date with Stay Up-to-Date the latest dates and information from Microsoft Project with Milestones refresh.
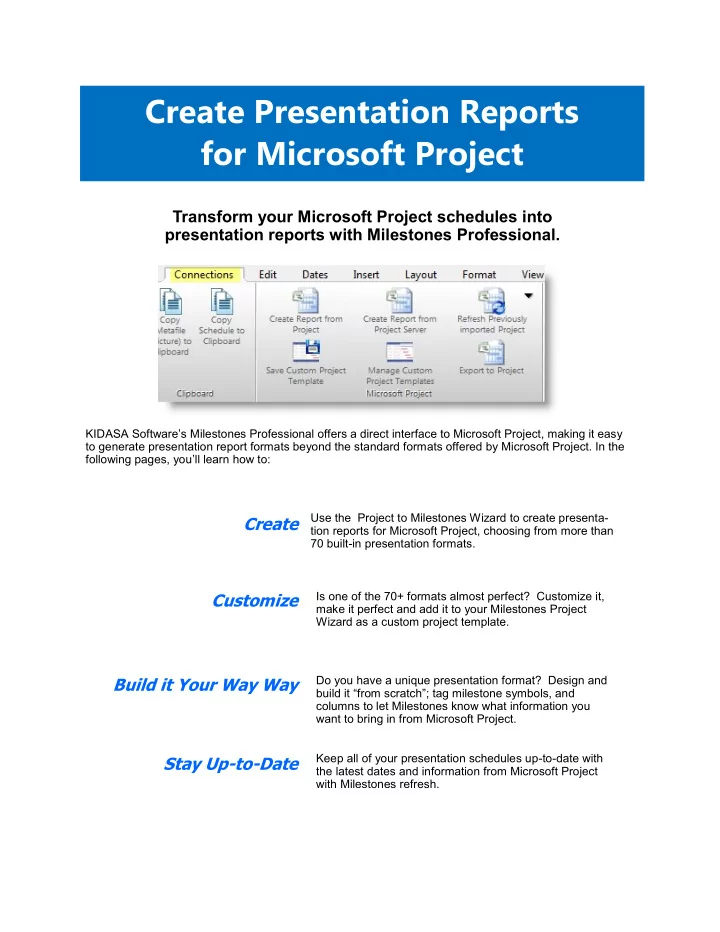
CREATE PRESENTATION REPORTS FOR MICROSOFT PROJECT Create presentation reports for Microsoft Project. The Connections tab on Milestones Professional ’ s toolbar offers easy access to all Microsoft Project options. Choose Create Report from Project or Create Report from Project Server to start the Project to Mile- stones Wizard. Connections Tab The Project to Milestones Wizard offers a visual representation of the schedule as it is created, allowing you to see the effects of the formatting choices you make in a dynamically updated screen. Start with one of the built - in formats or use your own custom chart to begin. Follow the prompts and watch as your Microsoft Project information is brought into a professional - looking Milestones schedule. Project to Milestones Wizard Create Presentation Reports for Microsoft Project - - Page 2
CREATE PRESENTATION REPORTS FOR MICROSOFT PROJECT Built - in templates over 70 templates in these categories: resources and other data by task, often Gantt contains layouts suited to a with a graph below the schedule. basic Gantt schedule, including start and finish dates. Status formats display current, remain- ing, or slipping tasks. Stoplight formats offer several commonly used presentation red, yellow, green stoplight charts for easy management Dashboard charts offer several unique viewing of key indicators. formats with the popular “ dashboard ” ap- pearance and content. Milestone charts show tasks with zero duration or finish dates only. Special offers three formats which did not fall into one of the previous catego- ries: Work remaining versus money re- S ummary charts are condensed presen- maining, percent complete bar graph, and tation formats. finish variance. Choose one of the earned value formats and show an earned value graph along with your project schedule. Resource charts show work variance, Create Presentation Reports for Microsoft Project - - Page 3
CREATE PRESENTATION REPORTS FOR MICROSOFT PROJECT Basic Gantt Chart Finish Dates Milestones Page 1 of 1 11/3/07 7/26/08 2007 2008 % Task name '08 Complete Name Apr May Jun Jul Aug Sep Oct Nov Dec Jan Feb Mar Apr May Jun Jul Aug Sep Oct 2 3 Wonderful New Widget Task 1 Task 1 Task 1-1 Task 1-1 Design Task 1-2 Phase 1 Task 1-2 Phase 1 Task 1-3 Task 1-3 Phase 2 Task 1-4 Task 1-4 Phase 2 Task 1-5 Task 1-5 Task 2 Task 2 Testing Task 3 Task 3 Phase 1 Task 3-1 Phase 1 Task 3-1 Phase 2 Task 3-2 Task 3-2 Phase 2 Task 3-3 Milestone - Finish Dates Task 3-3 Task 3-4 Task 3-4 Integration Task 4 Task 4 Phase 1 Task 4-1 Phase 1 Task 4-1 Phase 2 Task 4-2 Task 4-2 Phase 2 Task 5 Task 5 Manufacturing Task 5-1 Task 5-1 Manufacturing Task 5-2 Task 5-2 Financial Review Task 5-3 Financial Review Task 5-3 Manufacturing Analysis Task 5-4 Task 5-4 Manufacturing Task 5-5 Task 5-5 Analysis Refinement Task 6 Refinement Task 6-1 Task 6-1 Process Review Task 6-2 Task 6-2 Process Review Task 6-3 Task 6-3 Baseline Current Summary Baseline Summary Plan Critical Finish Summary Gantt - Basic Gantt Chart Gantt - RoadMap Jan'05 Feb'05 Mar'05 2 9 16 23 30 6 13 20 27 6 Sample Project Initiate Gather Requirements Assemble Project Charter Review Project Charter Sign-Off On Project Charter Project Management Detailed Analysis Refine Requirements Document Requirement Sign Off Project Management Design Screen A Specs Screen A Tech Inspection Report B Specs Report B Tech Inspection Interface C Specs Gantt - Roadmap shows current plan plus Gantt - Step by Step will guide you through baseline along with the task name. building your own format by adding col- umns, stoplights and graphs. Presentation Timeline '04 '05 '06 '07 '08 Task name III IV I II III IV I II III IV I II III IV I II PLANNING PROJECT MANAGEMENT SYSTEM TEST PLANNING INTEGRATION REQUIREMENTS SYSTEM ENGINEERING ANALYSIS MISSION OPERATIONS System Engineering Complete FABRICATE ATTITUDE CONTROL THRUSTER Spacecraft Engineering Complete TANK TEST THERMAL SPACECRAFT ENGINEERING VALVES CONTAINMENT SYSTEM ORBIT ADJUST PROPULSION DESIGN COMMAND AND CONTROL ASSEMBLE POWER PARTS CONTROLS Assurance and Testing Complete MATERIALS & PROCESSES CONTROLS POST RETRIEVAL REFURBISHMENT SYSTEM SAFETY TEST SUPPORT QUALITY ASSURANCE RELIABILITY ASSURANCE GSC DESIGN INTEGRATION AND TEST DATA REDUCTION TEST FACILITIES DEVELOPMENT SUPPORT ABORT SUPPORT CODE & CHECKOUT SOFTWARE REQUIREMENTS ANALYSIS Space Vehicle Completed LAUNCH SYSTEM INTEGRATION DESIGN INTEGRATION ANALYSIS DEVELOPMENT TESTING Software Complete Summary - Presentation Timeline Create Presentation Reports for Microsoft Project - - Page 4
Recommend
More recommend