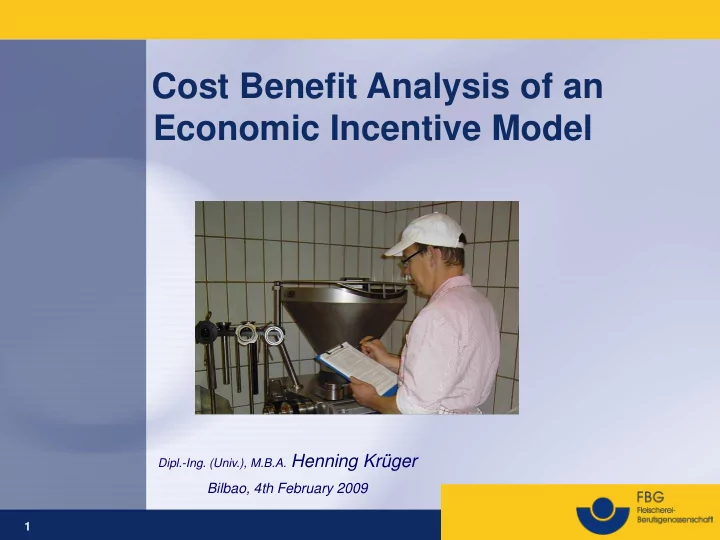

Cost Benefit Analysis of an Economic Incentive Model Dipl.-Ing. (Univ.), M.B.A. Henning Krüger Bilbao, 4th February 2009 1
Table of Contents • Why the incentive system was introduced • Who can profit from the system • Which preventive measures give premiums • Qualitative benefits from the system • Bonus point elasticity • Correlation with accident/disease rate development • Cost-benefit balance • Conclusion 2
Why the incentive system was introduced Incentive regardless of accident rate and costs Road accident prevention Prevention of occupational diseases Reinforcement of national prevention targets Means to evaluate the actual prevention status 3
Which preventive measures give premiums Safety Health Both Protection against Skin protection Reintegration of knife accidents long-term patients Protection against Protection against Training more than falls and slips cold legally required Machines Protection at VDU Audited OHS work system Traffic safety Ergonomics Noise protection 4
Preventive measures - example Do you solely use knives with a rounded point to cut sausages in your yes no shop? Do you always use safety knives to open spice bags and cut sausage yes no skins? What percentage of the total of your machines have been tested by an | | | | | independent institution for safety? For how many employees do you pay physical training to help strengthen | | | | | their vertebral column? 5
Qualitative benefits from the system I skin protection 2007 2002 traffic safety protection against falls and slips protection against knife accidents training more than legally required protection at VDU w ork ergonomics protection against cold safety of machines 0 20 40 60 80 100 degree of target fulfillment in % 6
Qualitative benefits from the system II difference 6-year versus first skin protection ever participants traffic safety protection against falls and slips protection against knife accidents training more than legally required protection at VDU w ork ergonomics protection against cold safety of machines 0 4 8 12 16 20 target fulfillment percentage points 7
Qualitative benefits from the system III Number of audited OHS systems 50 40 30 20 10 0 2005 2006 2007 2008 8
Bonus point elasticity I 100 30 90 target achievement in % 25 80 bonus points 70 20 60 50 15 40 10 30 20 5 10 0 0 safety of protection ergonomics protection training protection protection traffic skin machines against cold at VDU more than against against falls safety protection w ork legally knife and slips required accidents 9
Bonus point elasticity II degree of companies participating in % 30 25 20 15 10 5 0 2002 2003 2004 2005 2006 2007 professional driver's training 10
Correlation with accident/disease rate development I road accidents per 1000 FTE 30 25 20 15 10 5 0 2004 2005 2006 2007 optimum usage of driver's training no driver's training 11
Correlation with accident/disease rate development II 100 accident rate per 1000 FTE 80 60 40 y = -49,905x + 187,94 R 2 = 0,5591 20 0 2 2,2 2,4 2,6 2,8 3 premiums achieved in % (in 2007) 12
Correlation with accident/disease rate development III 100 6-year participants participants 2007 90 accident per 1000 FTE non-participants 2007 80 70 60 50 2001 2002 2003 2004 2005 2006 2007 year 13
Correlation with accident/disease rate development IV skin diseases reported per 1000 FTE 4 never participated in system 3,5 participated in system and campaign 3 2,5 2 1,5 1 0,5 0 2004 2005 2006 2007 14
Cost-benefit balance 9 premiums granted since 2002 8 theoretical accident costs reduction 7 since 2002 6 in million € 5 4 3 2 1 0 2002 2003 2004 2005 2006 2007 15
Conclusion The incentive system motivates for prevention Positive development of target achievement Not only the concrete measures are reinforced Positive effect on OSH indicators Expenditures are overcompensated by cost reduction The collected data can serve as a benchmark 16
Recommend
More recommend