COSC 340: Software Engineering Using the Debugger Michael Jantz - PowerPoint PPT Presentation
COSC 340: Software Engineering Using the Debugger Michael Jantz COSC 340: Software Engineering 1 Introduction What is it? A tool that supports examination of your program during execution How does it work? User attaches the
COSC 340: Software Engineering Using the Debugger Michael Jantz COSC 340: Software Engineering 1
Introduction • What is it? ‒ A tool that supports examination of your program during execution • How does it work? ‒ User attaches the debugger to the target process ‒ Debugger enters an event loop – waiting for debug events from the OS ‒ Enables reading and writing of the target process' address space ‒ Additional symbol tables enable translation of program symbols to lines and variables in the source code • Common debuggers in Linux ‒ gdb, sdb, ddd COSC 340: Software Engineering 2
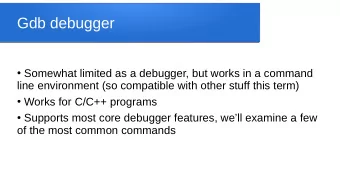
GDB • GDB ("The Gnu Project debugger") is a tool for debugging C/C++ code • Some capabilities ‒ Run programs ‒ Stop it on any line ‒ Examine various types of information, program variables ‒ Stop execution when a change occurs ‒ Change values or variables (during execution) ‒ Call program functions at any point during execution COSC 340: Software Engineering 3
Compilation for GDB • Code must be compiled with -g option ‒ > gcc -g -o file1 file1.c file2.c file3.o • Which files can you debug? ‒ Only debug source files compiled with -g (file1.c and file2.c – not file3.o) • Optimization not always compatible ‒ Using -g with -O2 might work, but not recommended COSC 340: Software Engineering 4
Building and Testing bash 1. Untar and navigate to bash-4.2 directory > tar xvzf cosc340-gdb.tar.gz > cd gdb/bash-4.2 2. Configure bash for build: > ./configure 3. Make bash using multiple jobs with CFLAGS=-g > make -j8 CFLAGS=-g 4. Test the bash executable: > ./bash --version COSC 340: Software Engineering 5
Using GDB with bash • Running GDB with program foo : ‒ > gdb ./foo • Build process created an executable named bash • To start bash under GDB do: ‒ > gdb ./bash-4.2/bash COSC 340: Software Engineering 6
Breakpoints • break (b) ‒ Sets a breakpoint in program execution ‒ tbreak (tb) sets a temporary breakpoint, which exists until its hit once • Breakpoint syntax ‒ b line-number ‒ b function-name ‒ b line-or-function if condition ‒ b filename: line number • info breakpoints – gives information on all active breakpoints • delete (d) – deletes the specified breakpoint number (e.g., d 1) COSC 340: Software Engineering 7
A Breakpoint in bash • bash is a shell program ‒ Provides a command line interface to the OS ‒ Interprets commands ‒ Sets up pipelines ‒ Manages jobs, etc. • Running bash under gdb will help you learn how the shell operates • How does bash handle and execute commands? ‒ Place a breakpoint in the execute_command function COSC 340: Software Engineering 8
Running bash under GDB • run (r) – runs the loaded program under GDB • Can also specify arguments and I/O redirection now ‒ gdb> r arg1 arg2 < input > output • For this example, we'll run a script with our bash executable: ‒ gdb> r ./finder.sh bash-4.2/ execute 20 COSC 340: Software Engineering 9
finder.sh find $1 -name '*'.[ch] | xargs grep -c $2 | sort -t : +1.0 -2.0 --numeric --reverse | head --lines=$3 • find $1 -name '*'.[ch] ‒ Find files with .c and .h extensions under the directory given by arg $1 • xargs grep -c $2 ‒ Search the set of files on standard input for the string given by arg $2. ‒ -c asks for the number of times $2 is used in each file • sort -t : +1.0 -2.0 --numeric --reverse ‒ Sort standard input and print the sorted order to standard output ‒ -t : +1.0 -2.0 says sort using the second column on each line ‒ --numeric says to sort numerically (as opposed to alphabetically) ‒ --reverse says sort in reverse order • head --lines=$3 ‒ Print only the first n lines of input, with n specified as arg $3 COSC 340: Software Engineering 10
Common GDB Commands • When you hit the breakpoint, you should see: Breakpoint 1, execute_command (command=0x724088) at execute_cmd.c:376 • GDB has stopped execution of bash ‒ Enables you to examine program variables / constructs at this point in execution • Try the following commands: ‒ list (l) – list the source code around where execution has stopped. Can also do: list n or list n , m to list code at a certain line or between lines ‒ backtrace (bt, where) – print a backtrace of all stack frames COSC 340: Software Engineering 11
Using the Frame Stack • GDB currently has the execute_command frame selected. • Use the info command to list information about the frame: ‒ info args – print the arguments passed into this frame ‒ info locals – print the local arguments for this frame ‒ help info – shows you everything info can tell you • Additionally, print information about other stack frames using ‒ up [n] – Select the frame n levels up in the call stack. n=1 if not specified. ‒ down [n] – Select the frame n levels down in the call stack COSC 340: Software Engineering 12
Control Flow • continue (c) ‒ Continue until the next breakpoint is reached, the program terminates, or an error occurs • next (n) ‒ Execute one instruction, step over function calls • step (s) ‒ Execute one instruction, step into function calls • finish (fin) ‒ Continue to the end of the function you're currently in • kill (k) ‒ Kills the program being debugged (does not exit gdb – preserves everything else from the session, i.e., breakpoints.) COSC 340: Software Engineering 13
Inspecting and Assigning • Notice that execute_command calls execute_command_internal with command as its argument. • To examine command (or any object) use: ‒ print(p) foo – prints the value of the variable foo ‒ whatis foo – prints the type of foo ‒ ptype tee – prints fields for the type tee COSC 340: Software Engineering 14
Inspecting and Assigning • Inspect the command object: ‒ gdb> whatis command • tells us the type of command . ‒ gdb> ptype command • displays all the fields the command type ‒ gdb> p command->value • prints the value of command->value • Assigning values in gdb: ‒ gdb> set var command=0x0 • sets the command to pointer 0x0 COSC 340: Software Engineering 15
Printing Examples (gdb) p command $14 = (COMMAND *) 0x724088 (gdb) ptype command type = struct command { enum command_type type; int flags; int line; REDIRECT *redirects; union { struct for_com *For; ... struct coproc_com *Coproc; } value; } * COSC 340: Software Engineering 16
Printing Examples (gdb) p command->type $15= cm_connection (gdb) p (struct connection *) command->value $16 = (struct connection *) 0x724048 (gdb) ptype ((struct connection *) command->value) type = struct connection { int ignore; COMMAND *first; COMMAND *second; int connector; } COSC 340: Software Engineering 17
Printing Examples (gdb) p ((struct connection *) command->value)->first $17 = (COMMAND *) 0x721108 (gdb) p ((struct connection *) command->value)->first->type $18 = cm_simple (gdb) ptype ((struct simple_com *) ((struct connection *) command->value)->first) type = struct simple_com { int flags; int line; WORD_LIST *words; REDIRECT *redirects; } * COSC 340: Software Engineering 18
Printing Examples (gdb) p ((struct simple_com *) ((struct connection *) command->value)->first)->words $19 = (WORD_LIST *) 0xdfdfdfdfdfdfdfdf (gdb) ptype ((struct simple_com *) ((struct connection *) command->value)->first)->words type = struct word_list { struct word_list *next; WORD_DESC *word; } * COSC 340: Software Engineering 19
Printing Examples (gdb) ptype ((struct simple_com *) ((struct connection *) command->value)->first)->words->word type = struct word_desc { char *word; int flags; } * (gdb) p ((struct simple_com *) ((struct connection *) command->value)->first)->words->word Cannot access memory at address 0xdfdfdfdfdfdfdfe7 COSC 340: Software Engineering 20
Calling Functions from GDB • Call command allows you to call other functions within gdb • Very useful for printing complex data structures COSC 340: Software Engineering 21
Call Example (gdb) b execute_simple_command Breakpoint 2 at 0x4380a4: file execute_cmd.c, line 3650. (gdb) c Continuing. (gdb) p simple_command $28 = (SIMPLE_COM *) 0x721148 (gdb) p simple_command->words $29 = (WORD_LIST *) 0x721fe8 (gdb) call _print_word_list(simple_command->words, " ", printf) (gdb) call fflush(stdout) find $1 -name '*'.[ch]$30 = 0 COSC 340: Software Engineering 22
Watchpoints • watch EXPRESSION ‒ Stops execution of your program whenever the value of EXPRESSION changes ‒ Can be useful if you find a variable or data has changed unexpectedly, but do not know what part of the code caused the change • Variants ‒ rwatch: stops whenever expression is read ‒ awatch: stops on read or write • Hardware support ‒ Watchpoints are very slow without hardware support ‒ x86 includes 4 debug registers (4 bytes each) for watchpoint support ‒ Watching structures larger than 32 bytes requires a software watchpoint, which is excruciatingly slow COSC 340: Software Engineering 23
GDB References • Start with the Unix manual ‒ > man gdb • While running GDB, use help ‒ gdb> help (h) command • Official documentation is available here: ‒ https://sourceware.org/gdb/current/onlinedocs/gdb/ COSC 340: Software Engineering 24
Recommend


More recommend
Explore More Topics
Stay informed with curated content and fresh updates.