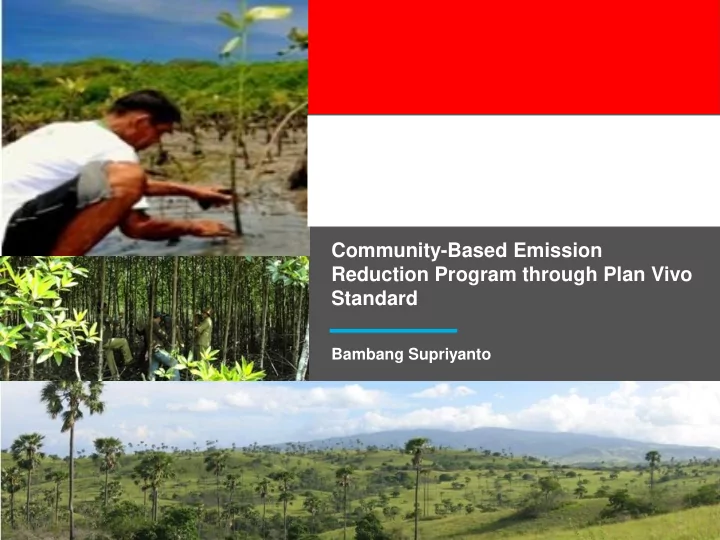

Community-Based Emission Reduction Program through Plan Vivo Standard Bambang Supriyanto
Presentation Outline The significance of communities’ role in reducing emissions Indonesian policies regarding community-based REDD+ Current status of Plan Vivo Project in Indonesia Lessons Learned How to Scale up?
The significance of communities’ role in reducing emissions Villagers living surrounding forests are one of key players in preventing deforestation and forest degradation: 2,036 villages located inside the forest and 19,247 village surrounding the forest Human Development Index below that average (<0.7) Positive correlation between village infrastructure and deforestation There is an increase of the social forestry target from 2.5 million hectares in 2014 (Ministry of Forestry, 2010) to 12.7 million hectares in 2019 (Medium- term National Development Plan 2015 – 2019) With an appropriate policy to achieve the social forestry target, villagers would play a significant role in climate change mitigation
The Role of FFI in developing community-based emission reduction program through Plan Vivo Standard In 2012, FFI started developing an international standardized payment for ecosystem services (PES) scheme that is acknowledged by Indonesian Government In 2013, supported by communities, FFI started a community- based PES using Plan Vivo standard
Current status of Plan Vivo Project in Indonesia
Rio� Kamunyang� Village� Description� Manjau� Village� Forest� Aik� Bual� Community� Forest� Forest� Location:� � � � Village� Laman� Satong� Durian� Rambun� Aik� Bual� District� Ketapang� Merangin� Lombok� Tengah� Province� West� Kalimantan� Jambi� Nusa� Tenggara� Barat� Land� Status� Village� Forest� Village� Forest� Community� Forest� Population� 290� Households� 87� Households� 163� Households� Concession� Area� 1,070� ha� 3,616� ha� 100� ha� Accounting� Area� 654� ha� 2,516� ha� 79� ha� Intervention� Avoided� deforestation� Avoided� deforestation� Ecosystem� rehabilitation/agroforestry� Baseline� Planned� deforestation� Unplanned� deforestation� Non-forest/degraded� � Land� conversion� 1000� Deforestation� rate� Tree� density� =� 91/ha� ha/year� 1.99%/year� Project� Scenario� Rate� of� deforestation� Deforestation� rate� Tree� density� =� 400/ha� 0.3%/year� 0.5%/year� Carbon� Stock� 97.88� ton� C/ha� 216.81� tC/ha� 93.09� tC/ha� Estimated� Emission� 4,258� tCO2e/year� 7,113� tCO2e/year� 1,542� tCO2e/year� Reduction� Sold� Carbon� Credit� 1,064� tCO2e/year� (2015- 1,064� tCO2e/year� (2015- 381� tCO2e/year� (2015-2017)� 2017)� 2018)� Price� USD� 14/tCO2e� USD� 14/tCO2e� USD� 14/tCO2e� Source� of� Fund� ICCO� Disney� BAT� �
Step in Developing the Scheme Participatory Planning Patrolling while doing inventory The results of inventory are used as the basis for developing reference emission level The results are also supported by satellite image analysis The plan is then implemented and verified Performance-based payments
Performance-based Payments Payment Deforestation (ha) Full payment (100%) <2.2 Partial payment (50%) <4.4 No Payment (0%) >4,4 Fund Based Payment
Lessons Learned Need to gradually transfer of knowledge to the community Performanced-based payments should be simplified Focus on the fund that is needed for guarding the forest, not on the fund that would be obtained FPIC and not only promise Limited access to fund instruments
How to Scale up? Through ACIAR Project, P3SEKPI is preparing to replicate the success of current development of Community-based ER program using Plan Vivo in three different locations, comprising: Rumbio Customary Forest, Riau Province Rakumpit Customary Forest, Central Kalimantan Province Yapase Customary Forest, Papua province A training on how to develop the scheme has been conducted involving three communities and related parties
Timeline
Looking Ahead Partnership with other agencies, NGOs, and private sectors Understanding the risks and issues that may hinder the development of the scheme Taking action
THANK YOU!
Recommend
More recommend