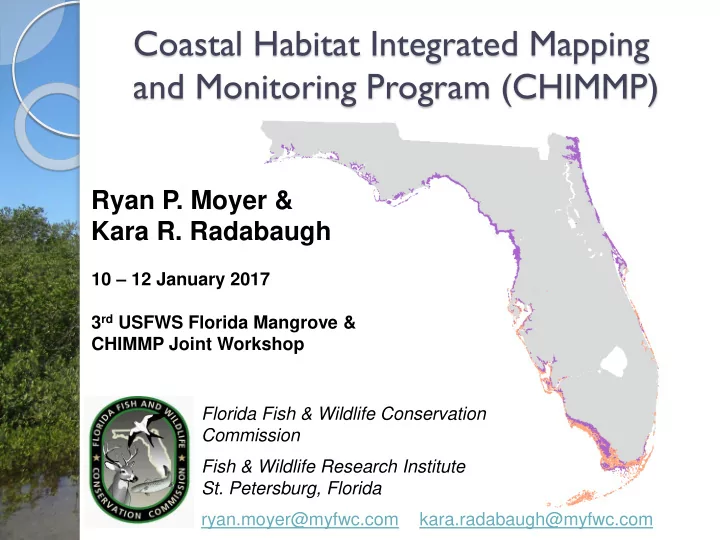

Coastal Habitat Integrated Mapping and Monitoring Program (CHIMMP) Ryan P. Moyer & Kara R. Radabaugh 10 – 12 January 2017 3 rd USFWS Florida Mangrove & CHIMMP Joint Workshop Florida Fish & Wildlife Conservation Commission Fish & Wildlife Research Institute St. Petersburg, Florida ryan.moyer@myfwc.com kara.radabaugh@myfwc.com
Introduction to CHIMMP Funded by Florida’s State Wildlife Grants (SWG) Program in order to support the study of high priority coastal habitats and meet requirements of the State Wildlife Action Plan
CHIMMP Team Ryan P. Moyer, Ph.D. (PI) Kara Radabaugh, Ph.D. (Coordinator, Co-PI) Amber Whittle, Ph.D. (Co-PI) Christina Powell (Coastal wetlands technician) Christi Santi (GIS specialist) Kathleen OKeife (Geospatial support)
CHIMMP Origin Modeled after the Seagrass Integrated Mapping and Monitoring Program (SIMM) ◦ Compiles statewide knowledge Current mapping and monitoring programs Regional status, threats, and recommendations • SIMM report located at: http://myfwc.com/research/habitat/s eagrasses/projects/active/simm/
CHIMMP Evolution 4-year program, 2013-2017 Identify and compile mapping and monitoring efforts for coastal wetlands ◦ Complete statewide report ◦ Identify gaps and needs ◦ Facilitate partnerships and collaboration throughout the state Pilot mapping studies Comparison monitoring studies Convene workshops with statewide partners
CHIMMP Workshops Designed to bring together representatives from mapping and monitoring programs from across Florida ◦ CHIMMP workshops to increase communication and coordination, pinpoint gaps and needs ◦ Information and past workshop presentations available on CHIMMP website: http://ocean.floridamarine.org/CHIMMP/
CHIMMP Workshops 1 st workshop April 2014 ◦ 44 attendees, 12 presentations 2 nd workshop September 2015 ◦ 49 attendees, 12 presentations 3 rd (final?) workshop January 2017
Common Feedback on Gaps and Needs for Florida’s Coastal Habitats Need more coordination among agencies Coastal wetlands monitoring often follows variable methodology Mapping more extensive than monitoring, but classifications vary widely. ◦ Historical/very recent data lacking What about oysters?
Oyster Integrated Mapping and Monitoring Program (OIMMP) Following models of SIMM and CHIMMP 1 st workshop to be held February 23-24 at Guana Tolomato Matanzas NERR Email Kara.Radabaugh@myfwc.com if you’d like to join the email list or attend the workshop
CHIMMP Monitoring Compare monitoring methodology ◦ Side-by-side comparison of common monitoring techniques (NERR, EPA, PCQ, MangroveWatch, etc …) ◦ Determine needs and best practices for monitoring Pilot monitoring studies in Clam Bayou, Gulfport.
Pilot Monitoring at Clam Bayou 2011 SWFWMD Restoration Project ◦ Planted as Spartina marsh; rapid mangrove encroachment December 2014 December 2016
CHIMMP Report Updates Prior workshop attendees contributed to statewide report ◦ 48 statewide contributors Workshop feedback dictated report content
CHIMMP Report Chapter Contents Regional map Introduction to regional history/ecology Threats to salt marshes and mangroves Summary of select mapping and monitoring programs Recommendations for future protection, management, and monitoring
CHIMMP Report Status T echnical review completed, currently in the process of copy/science editing and formatting for publication Scheduled to be published as an FWRI T echnical Report in the summer of 2017
Mapping Data in Florida Variety of mapping products available ◦ See website for list of land cover classification schemes, mapping data providers, and monitoring methodologies
How Many Acres of Coastal Wetlands are in Florida? FWC 2003 Cooperative NOAA National Florida Water Florida Land Cover C-CAP Wetlands Management Habitat Vegetation version 2.3 2010 Inventory Districts LULC and Land maps Cover 384,996 447,396 376,690 543,486 346,507 Salt marsh 606,044 588,320 608,901 719,441 173,318 Mangrove - 6,519 - - 455,093 Scrub mangrove Keys tidal rock - - 6,888 - - barren 800,000 700,000 600,000 500,000 Acres 400,000 salt marsh 300,000 mangrove 200,000 100,000 0 WMD FWC CLC v 2.3 C-CAP NWI LULC 2003 Veg
Ten Thousand Islands Example
How has Mangrove Extent Changed in the Past 30 Years?
Mapping Methodologies Improved SRWMD 1988 LULC SRWMD 2014 LULC Streams and waterways improved resolution Salt marshes shown in yellow New category: non-vegetated wetlands (forest green)
Variability in Mapping Data Everglades SFWMD Biscayne Bay SFWMD LULC data LULC data Year Mangrove Salt marsh Year Mangrove Salt marsh 1995 296372 8144 1995 14526 1155 1999 345908 45188 1999 16261 641 2005 15184 586 2005 348018 45335 2009 17455 5623 400,000 100,000 20,000 12,000 Mangrove swamp (acres) Mangrove swamp (acres) 350,000 Salt marsh (acres) Salt marsh (acres) 10,000 80,000 300,000 15,000 Mangrove 8,000 250,000 60,000 Salt marsh Mangrove 200,000 10,000 6,000 40,000 Salt marsh 150,000 4,000 100,000 5,000 20,000 2,000 50,000 0 0 0 0 1995 2000 2005 1995 2000 2005 Year Year
WMD data shows increase in mangrove extent and decrease in salt marsh extent Northwest FL, Southwest FL, and St. Johns WMD only 1990-1994 2009-2013 % change Class Mangrove (6120 45,089 56,295 24.9 FLUCCS) Saltwater marsh 228,905 228,096 -0.4 (6420 FLUCCS) Mangrove + salt 273,994 284,392 3.8 marsh
15 12 Statewide data 9 10 shows similar trend 5 0 in mangrove % change salt marsh -5 mangrove expansion at the -10 -8 expense of salt -15 -20 marshes -25 -22 FWC 2003 CLC 2016 (v 3.2) % CLC 2016 % Class FWC1985-89 FWC 2003 change (v 3.2) change Mangrove (incl. 547,000 594,839 9 614,000 12 Scrub Mangrove) Salt Marsh 486,000 447,396 -8 379,000 -22 Mangrove + salt 1,033,000 1,042,235 1 993,000 -4 marsh
Tampa Bay Example FWC 1985-1988 land 2016 Cooperative cover data Land Cover (v 3.2)
Mapping Summary Mapping data and categories can vary largely between sources, methodologies are often modified (and not directly comparable) Large availability of mapping data when compared to other coastal habitats (e.g. seagrasses, oysters)
Mapping Summary Land classification schemes are not designed to incorporate a mixture of vegetation types Hinders study of mangrove expansion, intrusion of invasive species
Monitoring Coastal Wetlands Two general types of monitoring: ◦ Short term monitoring at restoration or mitigation sites. ◦ Short to long term monitoring on protected lands – Tampa Bay Critical Coastal Habitat Assessment Methodology varies ◦ Summary of common monitoring protocols on website
Governor’s South Atlantic Alliance Coastal Wetlands Monitoring Database Compilation of coastal wetland monitoring programs in the southeast US. Report and monitoring database available at http://southatlanticalliance. org/coastal-wetlands- monitoring-report-and- database/
Questions? Mapping assistance provided by Christi Santi, Rene Baumstark, Jennylyn Redner Field assistance provided by Amanda Chappel, Taylor Nielsen, Emma Dontis, Reba Campbell
Recommend
More recommend