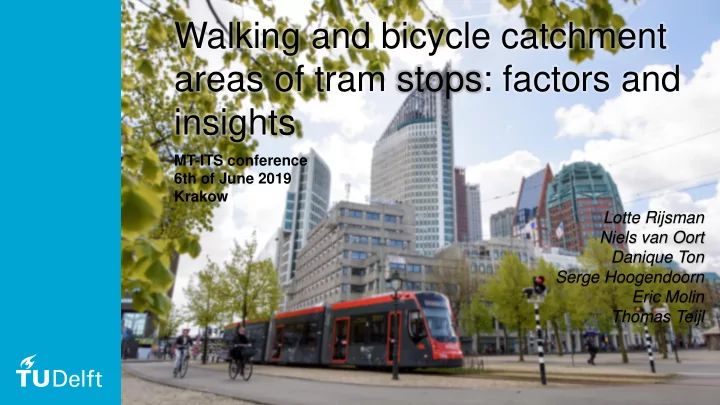

Walking and bicycle catchment areas of tram stops: factors and insights MT-ITS conference 6th of June 2019 Krakow Lotte Rijsman Niels van Oort Danique Ton Serge Hoogendoorn Eric Molin Thomas Teijl 1
Bicycle-transit combination Synergies from improved cycling-transit integration (Kager & Harms, 2017) 2
Bicycle and tram • Competitors at single trip level • Complement at total trip level 3
Research approach bicycle choice distance Literature review Literature review theoretical framework • Bivariate • Bivariate quantitative • Multivariate • Multivariate qualitative • • Motives Motives 4
Theoretical framework Feeder distance 5
Theoretical framework Feeder mode 6
7
Results: feeder distance (m) 8
Results: feeder mode by mode 9
Results: bivariate Feeder distance 10
Results: bivariate Feeder mode 11
Results Multivariate Feeder distance 12
Results Multivariate Feeder mode 13
Reason for not cycling 14
Choosing a further stop 15
Conclusions • Median feeder distance: 400m – Walking: 380m – Cycling: 1025m • • Feeder distance Feeder mode – – Feeder mode Feeder distance – – Transit stop density Transit stop density – Frequency of cycling – Home-based/activity-based • 3 barriers for cycling • Cyclists choose stops differently 16
Recommendations • Remove barriers for cycling • Use the data for estimating a choice model – Sensitivity – Combined choice • Multi-modal transport models 17
Questions? More information/contact • http://smartptlab.tudelft.nl/ • lotte.rijsman@rhdhv.com/ 18
Recommend
More recommend