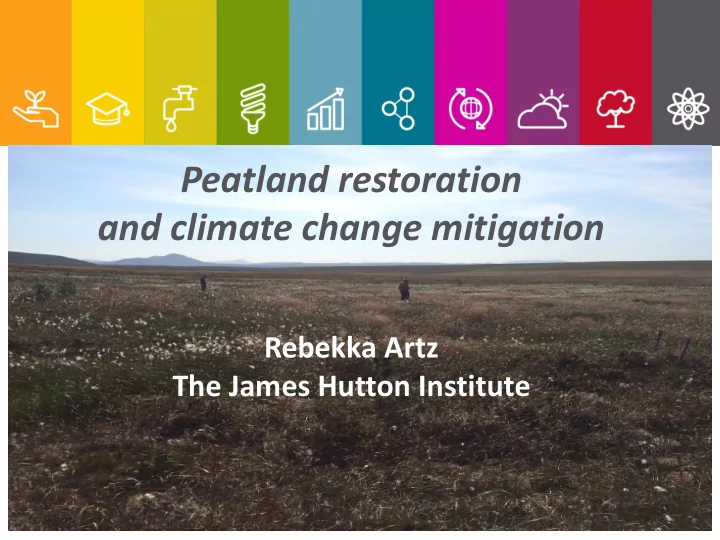

Peatland restoration and climate change mitigation Rebekka Artz The James Hutton Institute
Policy context – why restore peatlands? Natural peatlands (i.e. those unaffected by human disturbance) are net carbon • sinks. Degraded peatlands are a large source of carbon emissions. Scotland’s Climate Change Act (2009): • emissions target for 2050 for a reduction of at least 80 % from the baseline year 1990. • CBD Nagoya 2010 - Aichi Target 15/(EU Biodiversity Target 2): • by 2020, ecosystem resilience and the contribution of biodiversity to carbon stocks have been • enhanced, through conservation and restoration, including restoration of at least 15 per cent of degraded ecosystems … etc. IPCC 2013 Wetlands Supplement (WS): • the ‘new’ standard for incorporating emissions into national GHG Inventories for UNFCCC and • Kyoto Protocol submissions.
Scottish Government commitments • Peatland Action (£10 mi spend in 2017-18) • But where to restore?
There is a HUGE job to be done! • 1.7-2.3 million hectares = 22% of the land area of Scotland. • Mostly blanket bog (1.1 mi ha), some semi- confined peat (valley peats on mountains, 0.5 mi ha), upland (0.04) and lowland (0.03) raised bog . Small area of fen peatlands. • Much of this resource is eroding, drained, harvested or converted to other land uses (90% of raised bog, >50% of blanket bog)
What condition are the peatlands in? How to assess restoration success? • Monitoring is only carried out on designated sites (small proportion of land area) so we need a better way to assess peatland condition at national scale • One approach is to model condition across the national resource, using remote sensing approaches • Definition of “successful restoration” – what are the criteria? At what scale?
Effectiveness of a MODIS-based model CSM Site MODIS DEM Condition Time series Modelling 100m resolution ~ 7 million cells
Peatland condition modelling – first results • First (!) national scale model of current peatland condition produced, based on MODIS (paper in revision). Trained against SNH’s Common Standards Monitoring dataset • Suggests geographical differences - Future climate envelope for peatlands in good ecological condition? blue = favourable, yellow = unfavourable
Peatland GHG emissions • Committee on Climate Change Scotland report (Sept 2018) recommends including peatland emissions into the UK GHG Inventory • The UK GHG Inventory essentially only needs know the main condition category and the corresponding emission factor (EF) as a starting point. • Changes through time are then simply annual updates of these areas and EFs.
More detailed classification system: Sentinel – 2 based classification UK Gov (BEIS) funded 2016-17
Sentinel-2 based condition modelling – first results • Initial approach significantly overestimated heather-dominated bog and extent of restoration sites in N Scotland • Pixel based model was better at accurately predicting condition classes with high number of input pixels, poorer at predicting condition classes with limited input data • Highlights the need for appropriate ground observations
How to include peatlands in the UK GHG Inventory • Method available from 2013 IPCC Wetlands Supplement, but countries with significant land cover are expected to use Tier 2 (country-specific) methodology • Recent BEIS-funded project produced evidence that emissions from UK peatlands can be more accurately quantified with a Tier 2 (country-specific) approach
Implementing GHG emissions accounting Requires changes to the Inventory (likely to happen for next year’s ▪ submissions) Requires more work to accurately map the different condition categories ▪ (possibly using remote sensing) Requires more work to define peatland restoration areas and a target ▪ state in Inventory terms (i.e. when does a site that has been rewetted reap the GHG benefits) But: Prepares the path for appropriate monitoring, reporting and ▪ verification (MRV) of emissions from UK peatlands and mitigation following restoration (i.e. an instrument to assess effectiveness of Peatland Action programme)
Ongoing emissions monitoring essential Emissions figures are not static entities – • changes as restoration progresses Community composition critical – drought • resilience/photosynthetic potential differs between functional vegetation types Effects of climatic change (increased risk of • summer drought)
Resilience of restored peatlands Sphagnum contributes a large part • of the C fixing potential per annum, but is most affected in drought years Species have different niche • requirements (e.g. lawn/hollow Sphagna less resilient to drought) Restoration sites are at higher • drought risk as the primary colonising species are mainly lawn formers Potential to assess using Sentinel- • 2 and assess short term impact on GHG emissions
Summary • Significant GHG benefits from near natural peatlands, restoration of degraded sites is a strong mitigation option • Where the money should be spent is not so easy to answer, work is ongoing on mapping peatland condition • GHG benefits also require long-term monitoring of restoration sites to assess resilience to climatic change - getting the hydrology and the vegetation community right is key.
Contacts: - Digital soil mapping: Matt Aitkenhead, Alessandro Gimona, Allan Lilly - Greenhouse gas monitoring: Myroslava Khomik; Mhairi Coyle - Remote sensing and modelling: Gillian Donaldson-Selby, Laura Poggio, Alessandro Gimona, Pauline Miller, Matt Aitkenhead,
Recommend
More recommend